

Pi Network Price Forecast: Rising momentum and strong whale demand put PI on breakout watch
- Pi Network trades in green on Monday, nearing a key resistance zone, a breakout above suggests a rally ahead.
- On-chain data shows large whale orders, indicating strengthening accumulation and improving investor confidence.
- The technical outlook suggests a potential upside move, with momentum indicators signaling a bullish bias as buying pressure builds.
Pi Network (PI) begins the week on a positive note, extending its weekend gains and approaching a key technical barrier around $0.247 at the time of writing on Monday. Growing momentum, coupled with increased whale accumulation, has lifted sentiment, putting PI on watch for a potential breakout if buyers step in.
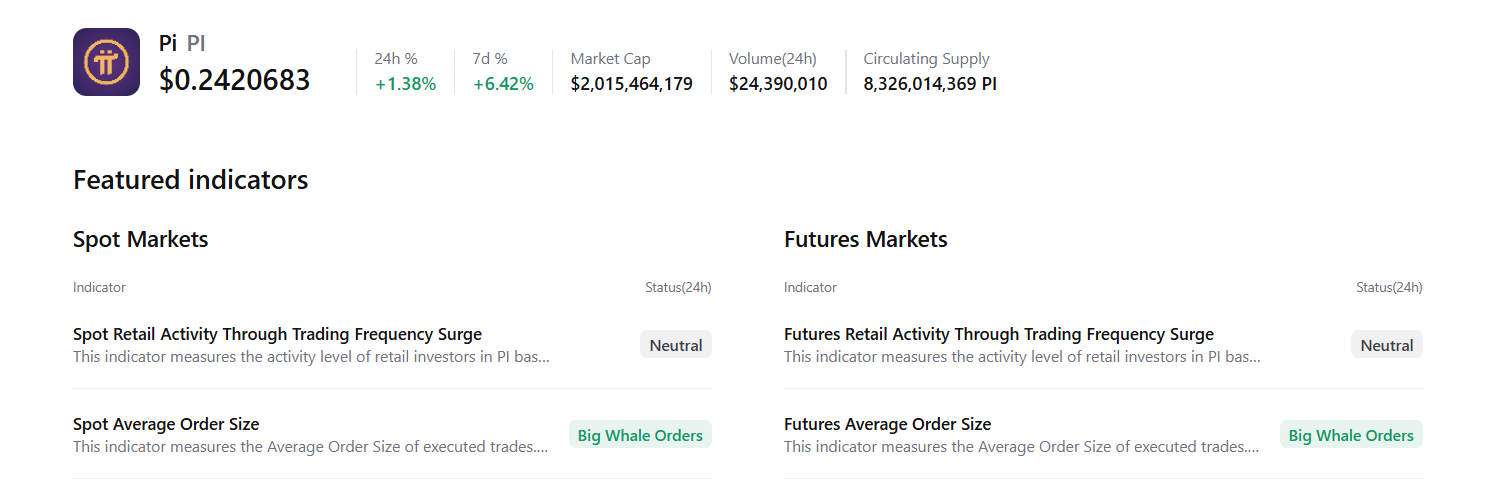
Large whale orders in the spot and futures markets
CryptoQuant summary data supports a positive outlook for Pi Network, as spot and futures markets show large whale orders, signaling that a rally may be forming.
Pi Price Forecast: PI momentum indicators show bullish bias
Pi Network declined nearly 5% on Friday, retesting the weekly support level at $0.221, and recovered most of its losses over the weekend. At the time of writing on Monday, it nears the 50-day Exponential Moving Average (EMA) at $0.242. This 50-day EMA roughly coincides with the 38.2% Fibonacci retracement level at $0.247 (drawn from the August 30 high of $0.398 to the October 10 low of $0.153) and the descending trendline, making it a key resistance zone to watch.
If PI breaks and closes above the descending trendline on a daily basis, it could extend the rally toward the 50% price retracement level at $0.276.
The Relative Strength Index (RSI) on the daily chart reads 56, above the neutral level of 50, indicating bullish momentum gaining traction. Additionally, the Moving Average Convergence Divergence (MACD) showed a bullish crossover last week, which remains intact, further supporting the bullish thesis.
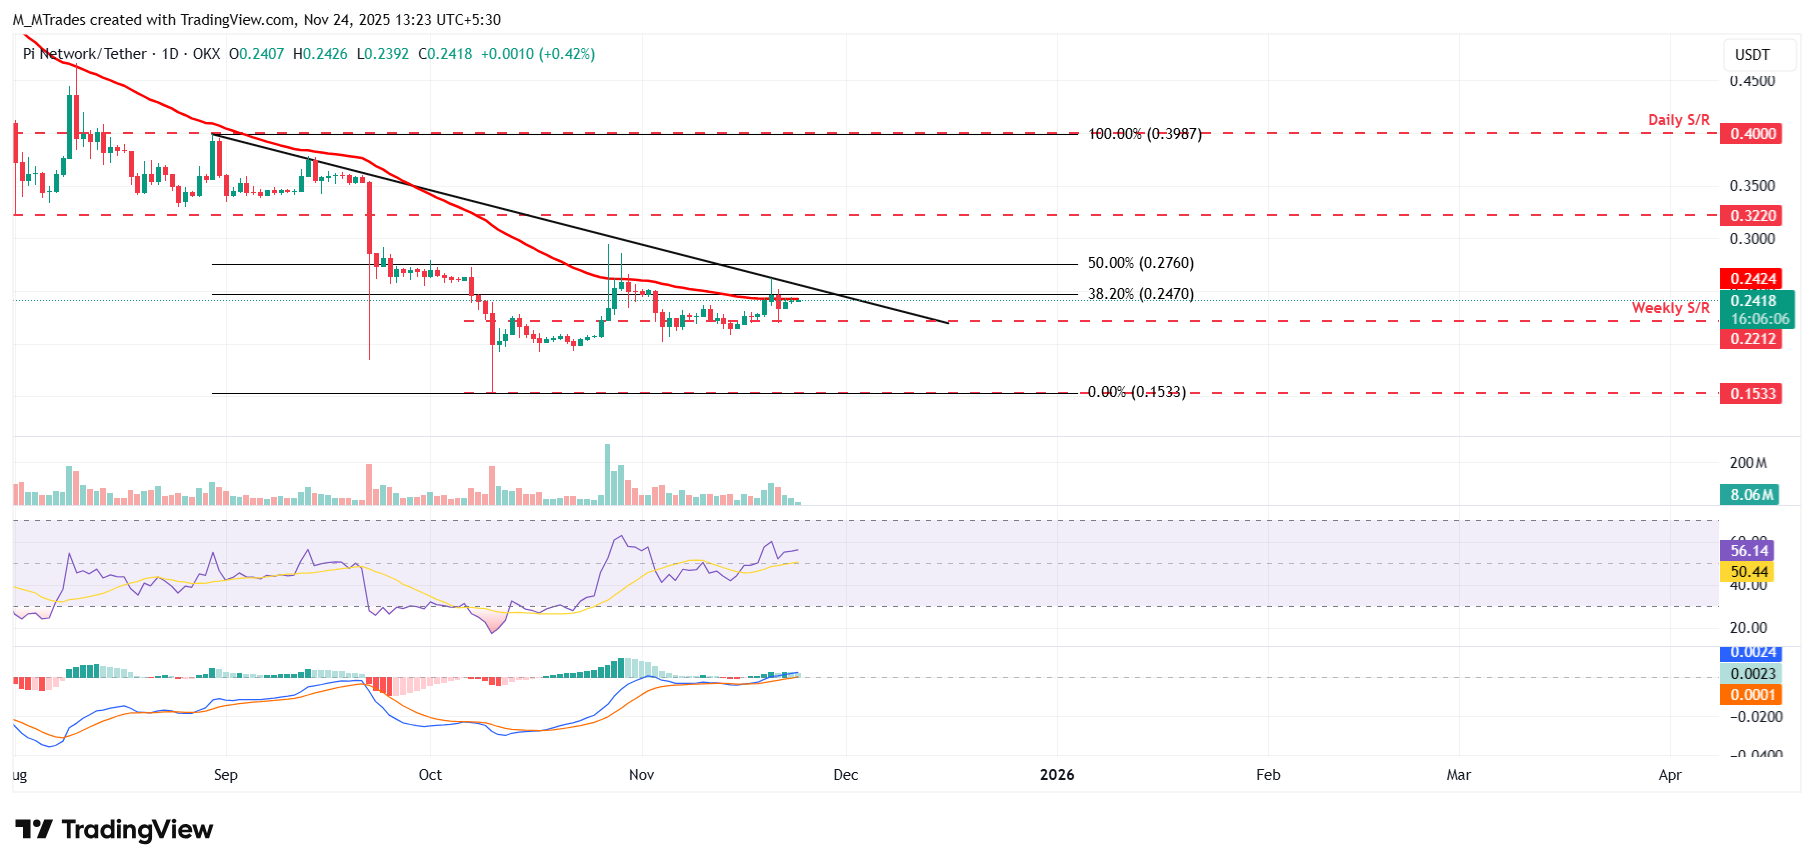
On the other hand, if PI faces rejection from the 50-day EMA at $0.242, it could extend the decline toward the weekly support at $0.221.
Nothing in this material constitutes investment advice, personal recommendation, investment research, an offer, or a solicitation to buy or sell any financial instrument. The content has been prepared without consideration of your individual investment objectives, financial situation, or needs, and should not be treated as such.
Past performance is not a reliable indicator of future performance and/or results. Forward-looking scenarios or forecasts are not a guarantee of future performance. Actual results may differ materially from those anticipated.
Mitrade makes no representation or warranty as to the accuracy or completeness of the information provided and accepts no liability for any loss arising from reliance on such information.
Recommended Articles


