

Top Crypto Gainers: Pi Network gains on gaming boost as Sky, Ether.fi test key levels
- Pi Network is up nearly 3% on Friday, marking its third consecutive day of uptrend.
- Sky’s recovery hits the crucial $0.05000 psychological level after the 6% rise on Thursday.
- Eth.fi indicates a possible trend reversal with a cup-and-handle breakout, but faces multiple overhead resistances.
Pi Network (PI), Sky (formerly MakerDAO), and Ether.fi (ETHFI) are among the top-performing crypto assets over the last 24 hours, logging steady gains amid a largely volatile market. Pi Network’s rally, driven by the CiDi games partnership, and the recovery in Sky and Ether.fi, are likely to extend gains if Bitcoin remains above $90,000, avoiding the pullbacks seen last week.
Pi Network rallies with expansion in the gaming sector
Pi Network edges higher by nearly 3% at press time on Friday, marking its fourth consecutive bullish candle. The expansion of PI token’s use case in the gaming segment, with the CiDi Games partnership announced on Wednesday, serves as the primary catalyst.
The PI token bulls aim to reclaim the $0.3000 round figure to challenge the $0.3220 resistance level marked by the August 1 low.
Technically, the recovery run in PI is gaining momentum, as the Relative Strength Index (RSI) on the daily chart is at 71, signaling overbought conditions and heightened buying pressure. If RSI holds steady above 70, PI could extend its recovery, but levels above 80 could signal a trend reversal as buying pressure becomes unsustainable.
At the same time, the Moving Average Convergence Divergence (MACD) extends the uptrend with successively rising green histogram bars on the same chart, indicating increasing bullish momentum.
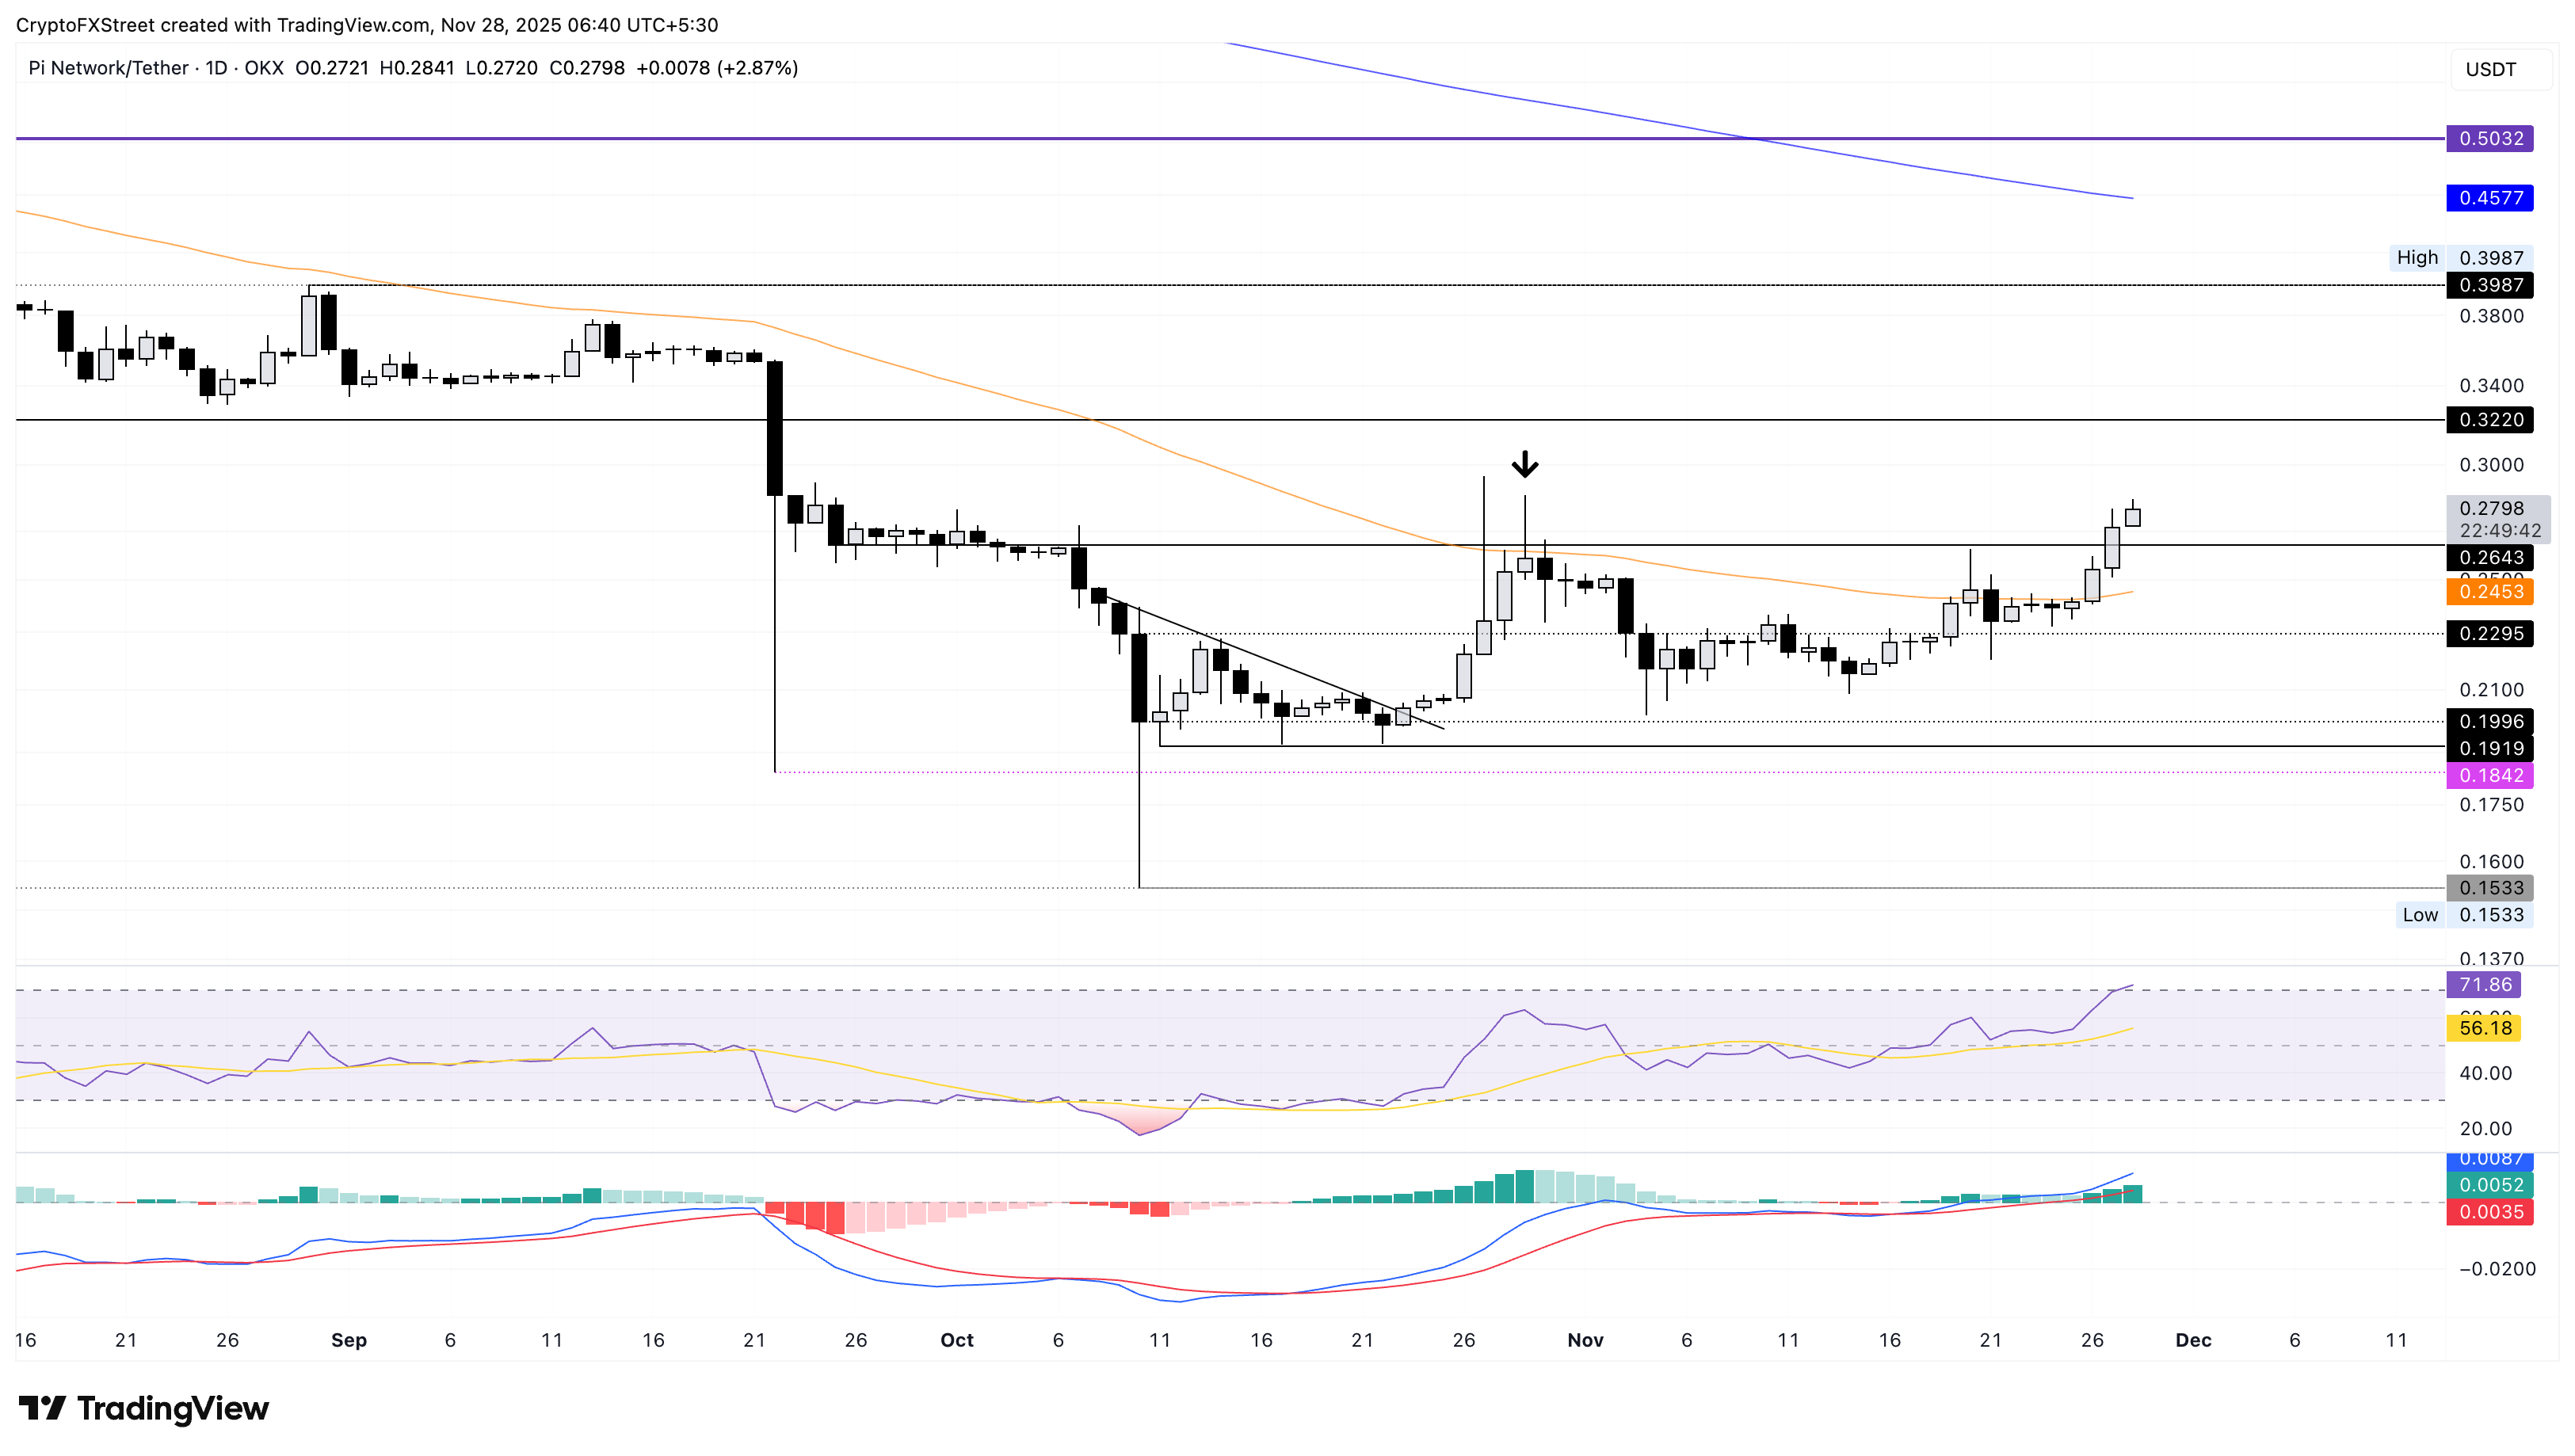
If PI takes a bearish reversal, it could test the 50-day Exponential Moving Average (EMA) at $0.2453 as the immediate support.
Sky approaches a crucial psychological level
Sky struggles to surpass the $0.05000 psychological resistance after two consecutive days of over 6% gains. At the time of writing, SKY takes a breather of nearly 2% on Friday, failing to crossover the R1 Pivot Point at $0.05003 on the 4-hour chart.
A potential rebound to a decisive close above this level could extend the rally towards the R2 Pivot Point at $0.05682, with the 200-period EMA at $0.05157 serving as an intermediate dynamic resistance.
The intraday pullback aligns with a loss of momentum, as indicated by the technical indicators on the 4-hour chart. The RSI at 68 slips below the overbought zone while the MACD and signal maintain a steady uptrend.
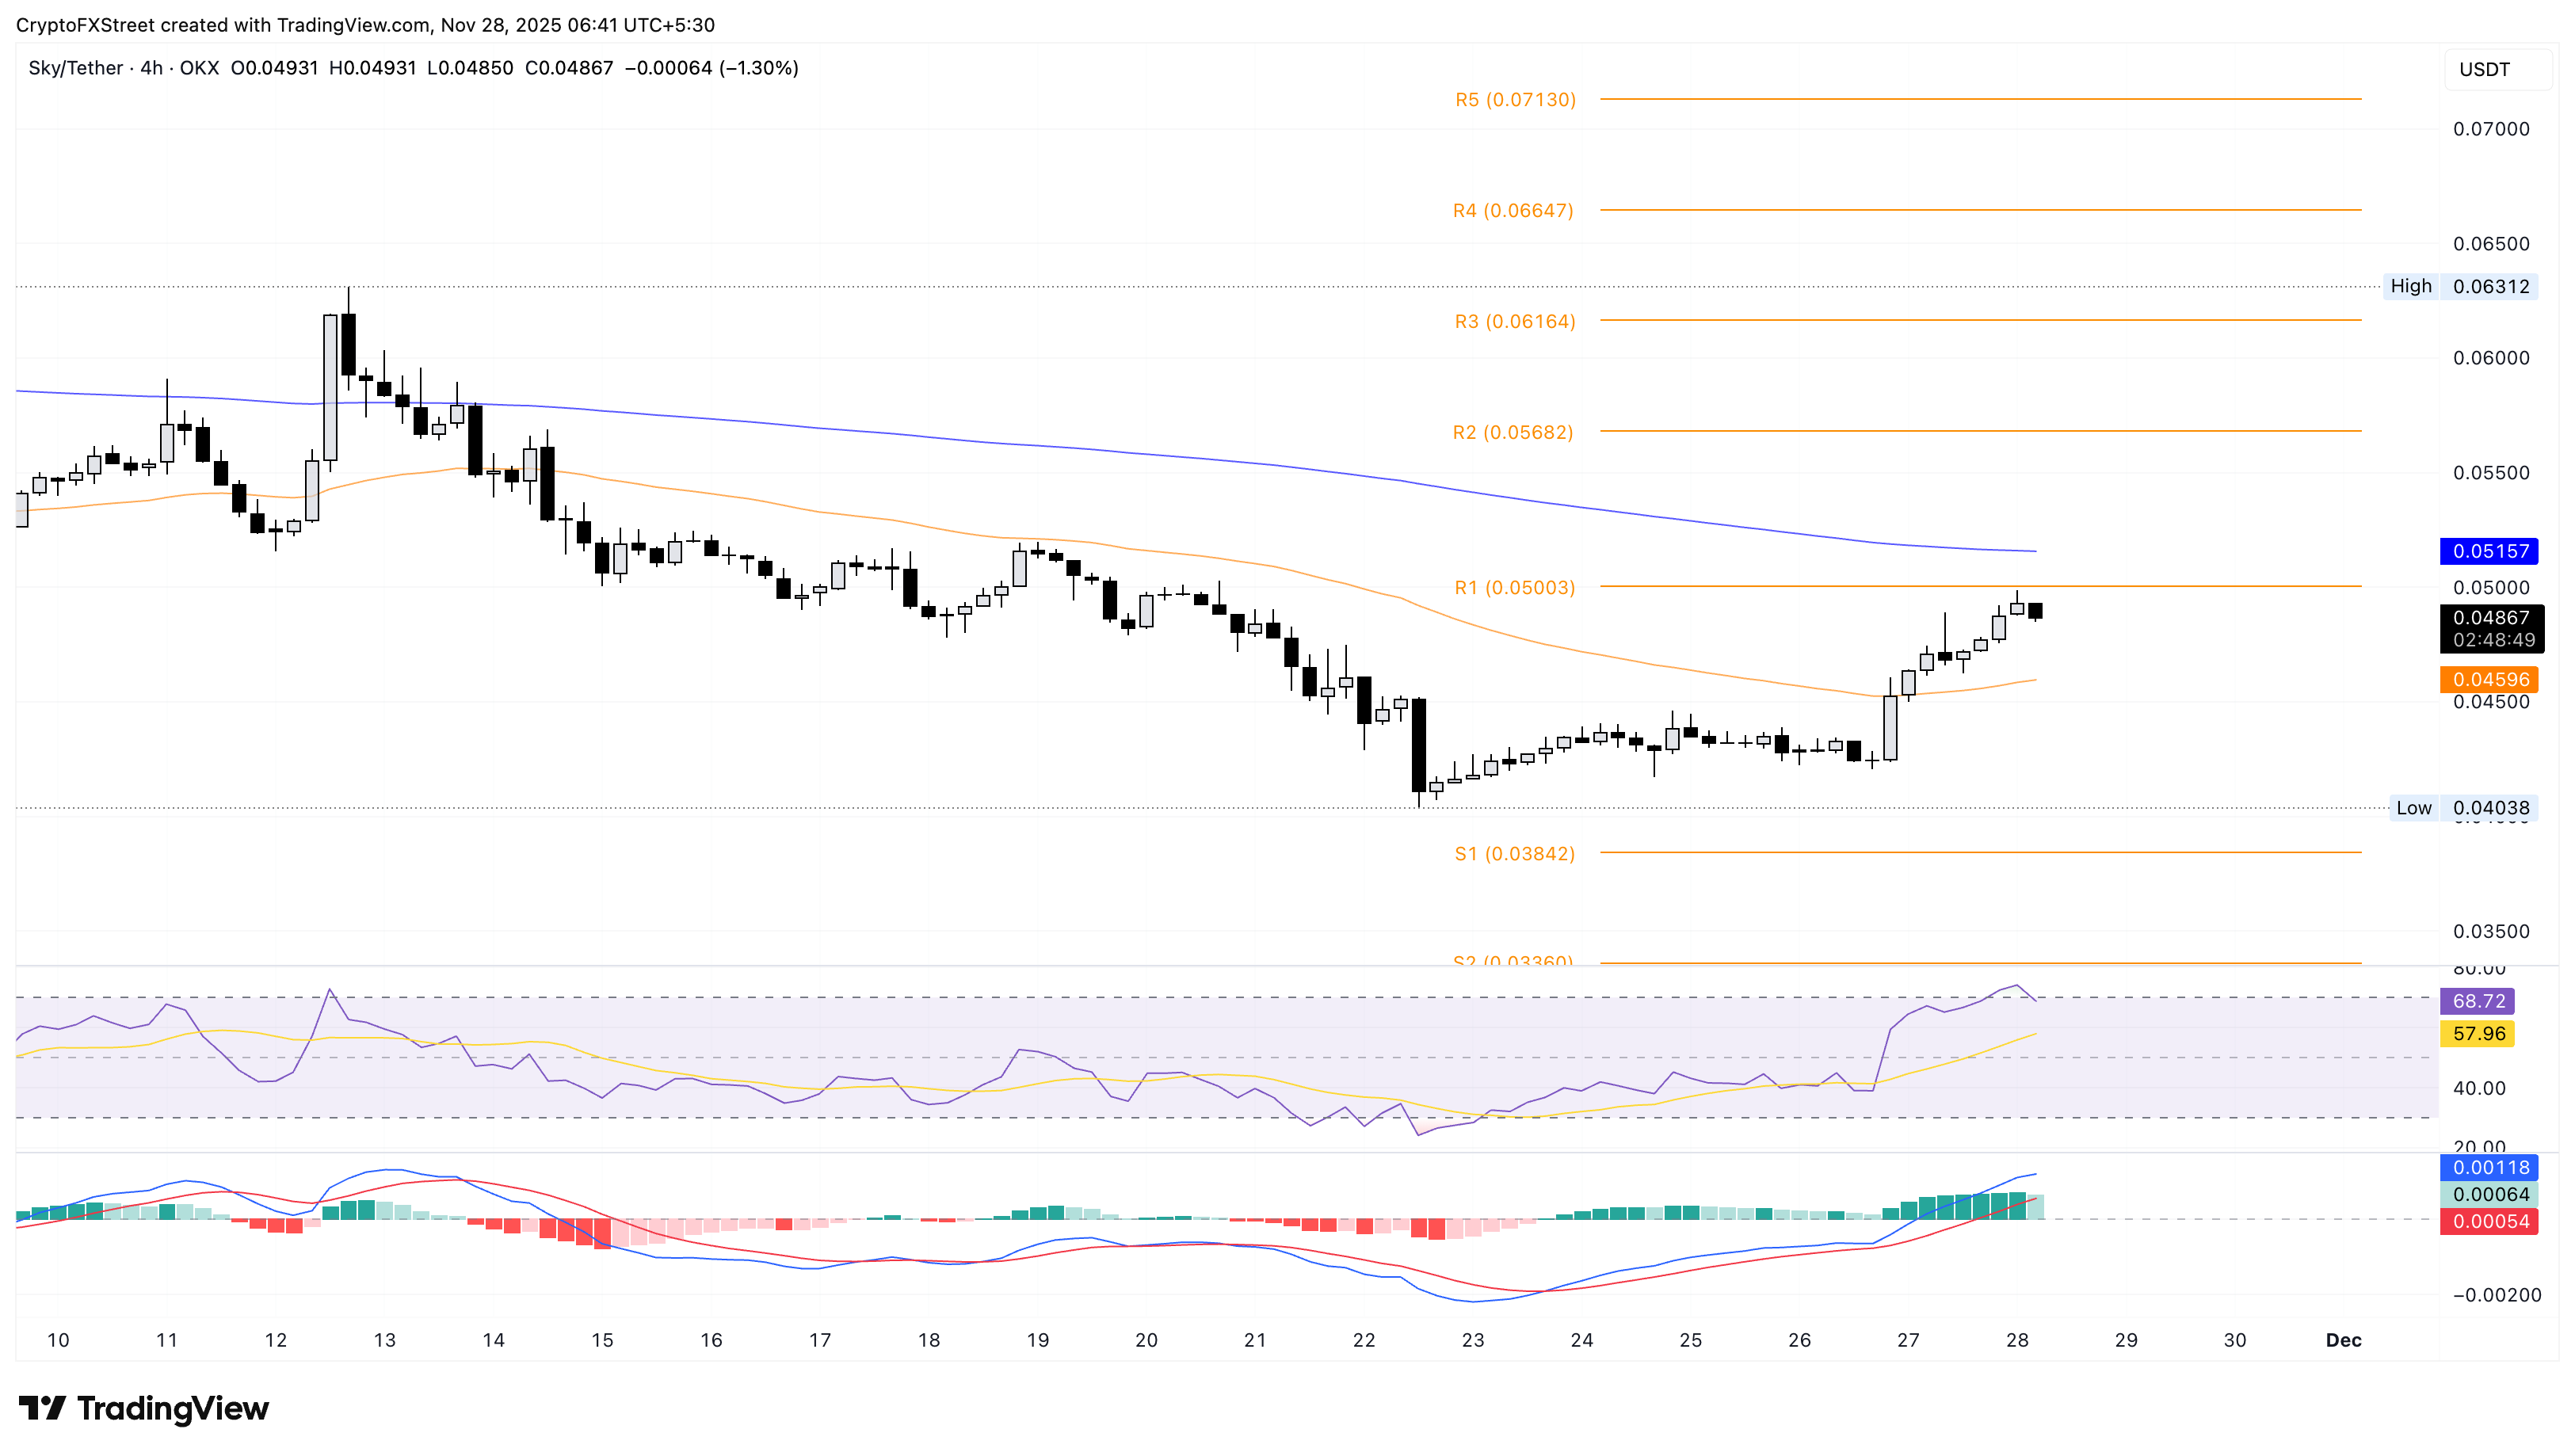
A possible extension of the pullback could test the 50-period EMA at $0.04596.
Ether.fi bulls prepare for a potential post-retest rebound
Ether.fi is down 1% at press time on Friday, risking a pullback below the $0.800 level. ETHFI’s reversal from the R1 Pivot point at $0.847 on the 4-hour chart aims for the 50-period EMA at $0.777, which hovers near the neckline of the broken cup and handle pattern at $0.772.
If ETHFI tests the 50-period EMA, it will also mark the pattern breakout retest, shifting the bullish attention towards a potential post-retest reversal. In case the post-retest rebound in ETHFI crosses above $0.847, the rally could target the 200-period EMA at $0.907.
Technically, the bullish momentum is decreasing amid the retest as the RSI at 60 retraces towards the halfway line while the MACD and signal line take a lateral shift, risking a potential crossover.
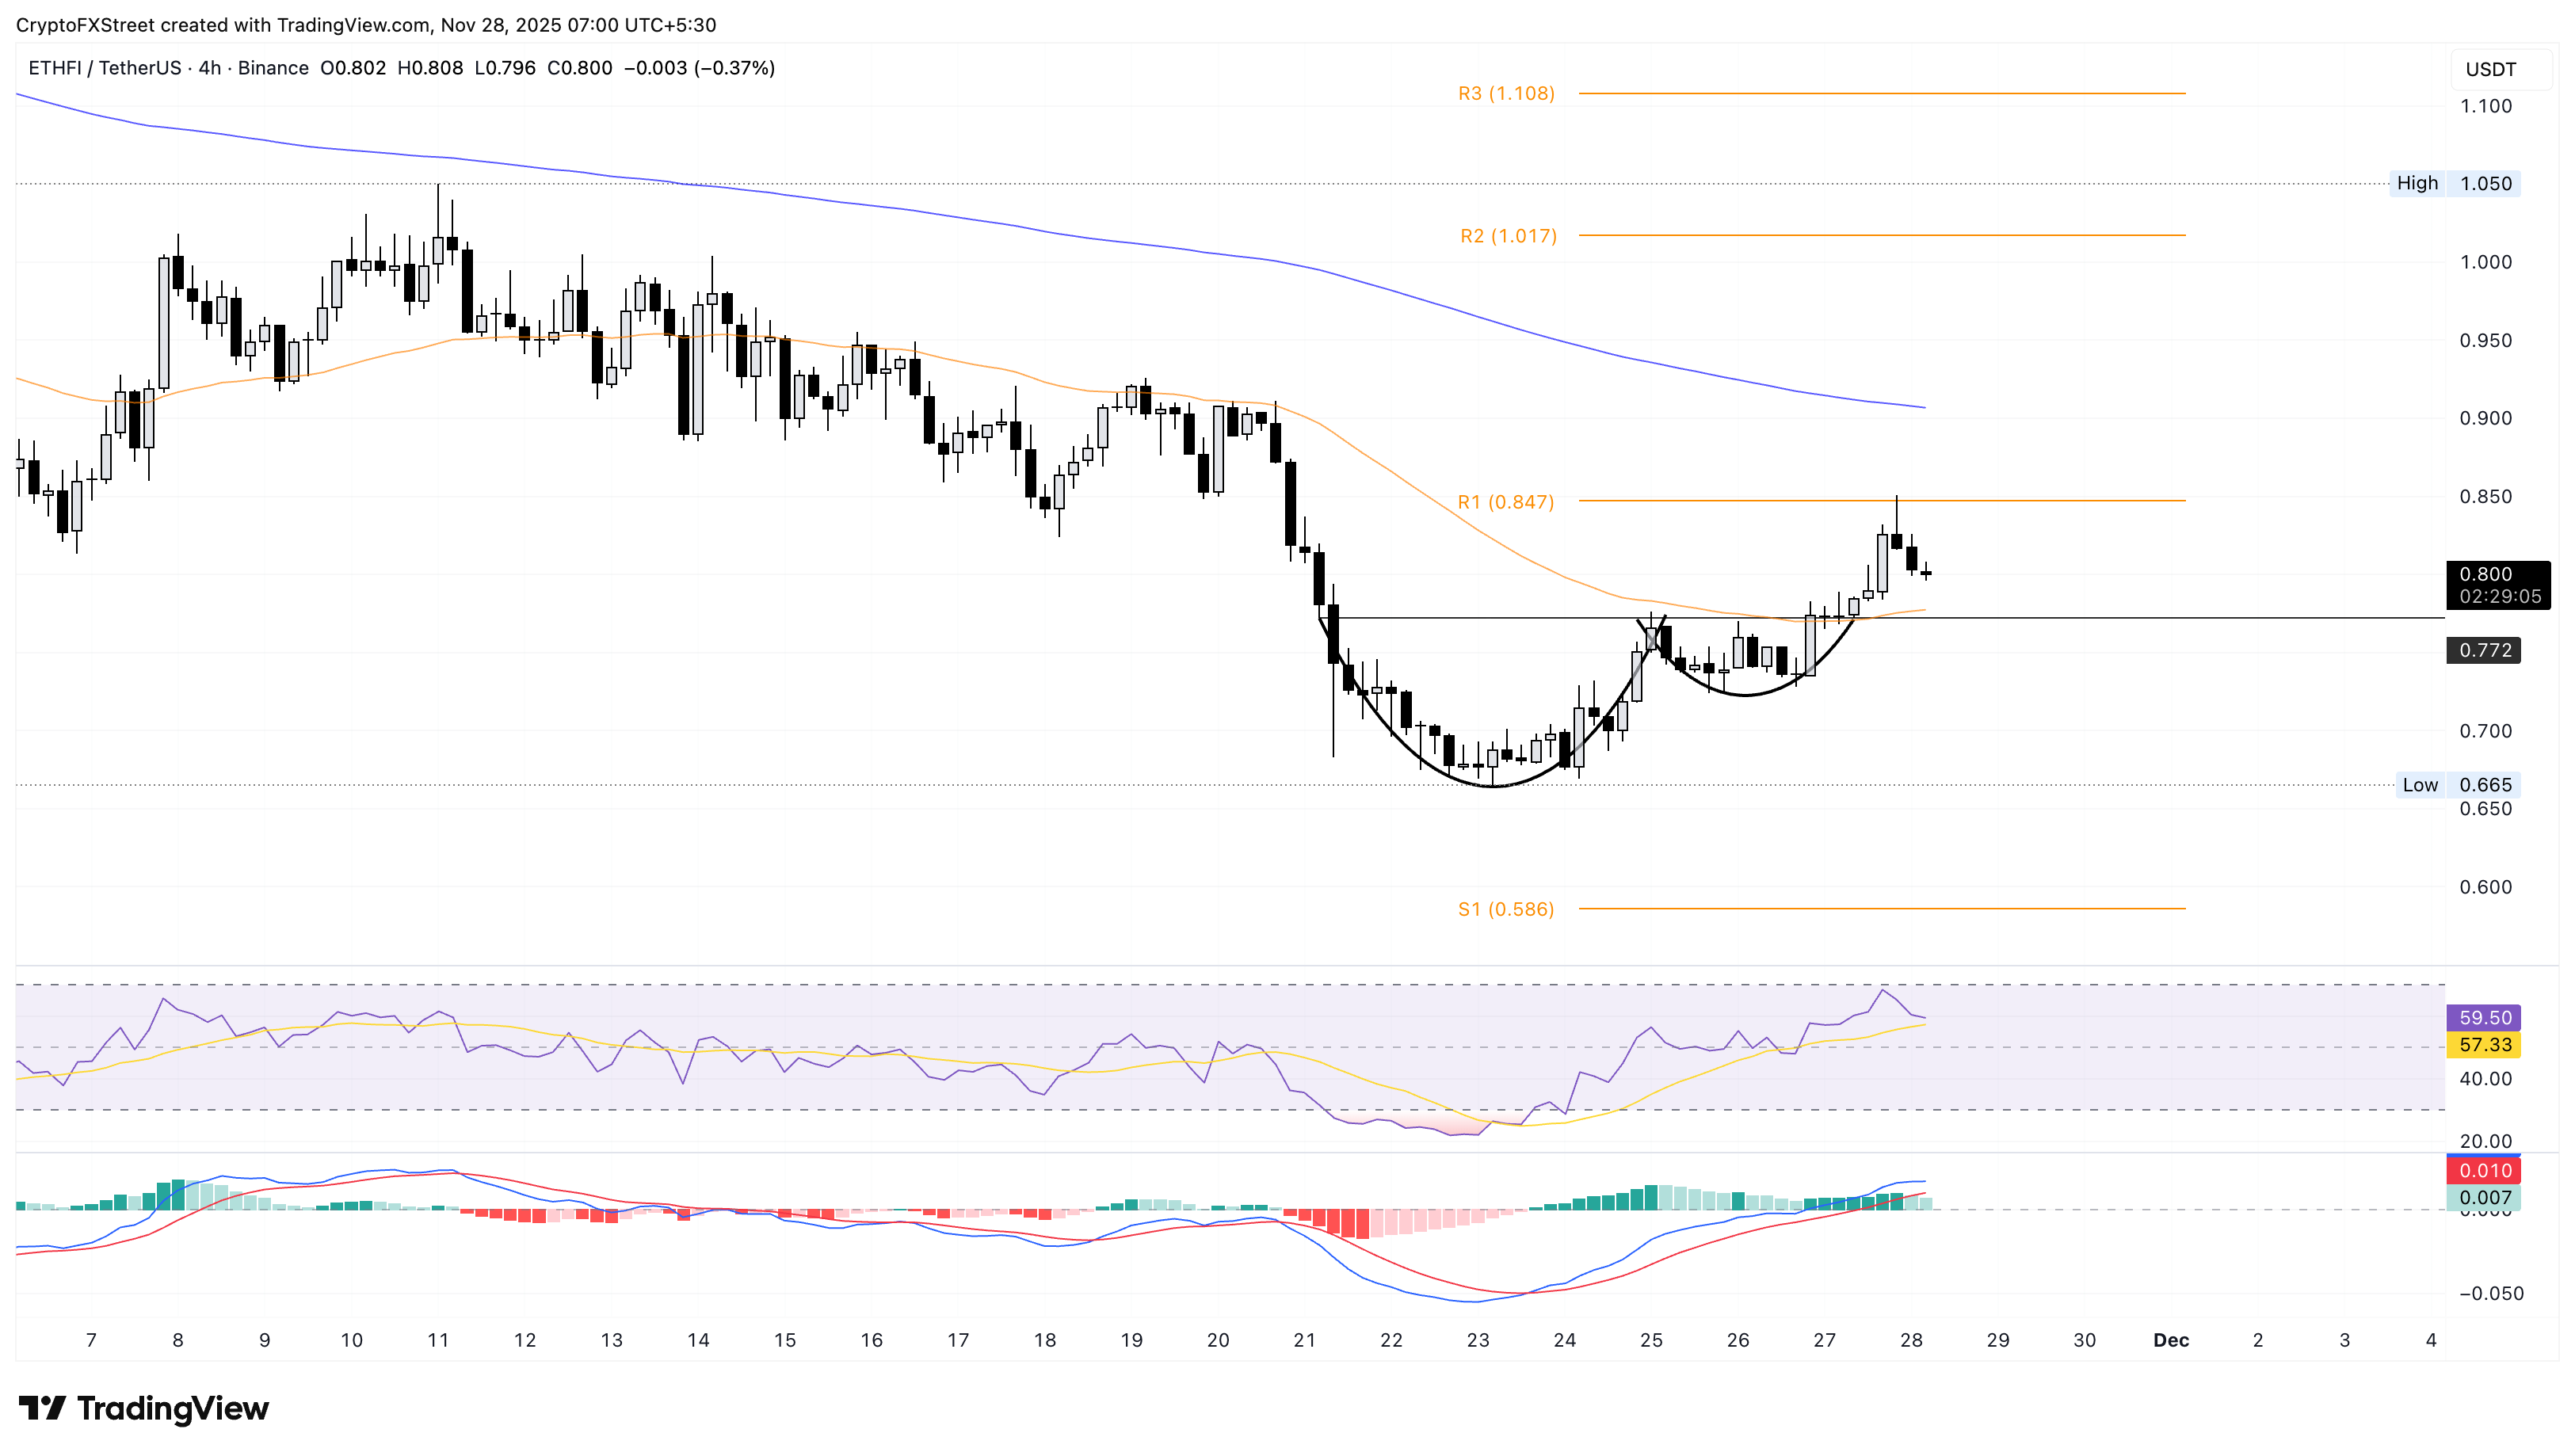
However, a pullback below the 50-period EMA at $0.777 could risk a nosedive to the $0.665 low recorded on Sunday.
Nothing in this material constitutes investment advice, personal recommendation, investment research, an offer, or a solicitation to buy or sell any financial instrument. The content has been prepared without consideration of your individual investment objectives, financial situation, or needs, and should not be treated as such.
Past performance is not a reliable indicator of future performance and/or results. Forward-looking scenarios or forecasts are not a guarantee of future performance. Actual results may differ materially from those anticipated.
Mitrade makes no representation or warranty as to the accuracy or completeness of the information provided and accepts no liability for any loss arising from reliance on such information.
Recommended Articles


