

Ripple Price Forecast: XRP trades sideways amid low on-chain activity, whale selling
- XRP extends sideways action between support at $2.15 and resistance at $2.30.
- XRP Ledger’s daily active addresses drop to 19,200 as investors retreat to the sidelines.
- Selling pressure deepens as whales continue offloading tokens, weakening XRP’s recovery potential.
Ripple (XRP) is trading in a narrow range, with support at $2.15 and resistance at $2.30 at the time of writing on Friday. For four consecutive days, the cross-border remittance token has remained in this narrow range, suggesting a battle for control between the bulls and the bears.
Meanwhile, low retail demand, as highlighted in this report, continues to suppress XRP’s recovery potential. A weak derivatives market alongside macroeconomic uncertainty ahead of the Federal Reserve’s (Fed) December monetary policy meeting is building risk-off sentiment, which may continue to cap rebounds.
XRP recovery stalls amid low on-chain activity
On-chain activity on the XRP Ledger (XRPL) has remained significantly suppressed over the last few months. According to Santiment data, since June, the number of daily active addresses on the network has not exceeded 100,000.
The Daily Active Addresses chart below shows that approximately 19,200 addresses transacted on the XRPL on Thursday, compared to 581,000 in mid-June. Low on-chain activity negatively affects adoption, demand, and user engagement, making it difficult for bulls to sustain price increases.
 [13-1764330712358-1764330712358.59.47, 28 Nov, 2025].png)
At the same time, large-volume investors, also known as whales, continue to offload XRP, further intensifying selling pressure. The Supply Distribution metric below shows that the cohort of investors holding between 100,000 and 1 million tokens (blue line) currently accounts for 9.81% of the total supply, down from 10.06% on November 1 and 10.21% on September 4.
Subsequently, addresses holding between 1 million and 10 million tokens (red line) account for 6.75% of XRP’s total supply, down from 9.76% on November 1 and 10.75% on September 4.
 [13-1764330738940-1764330738940.59.53, 28 Nov, 2025].png)
The sharp downtrend in whale holdings backs the sticky risk-off sentiment. If it persists, recovery in the XRP price could be a pipe dream while increasing the odds of the downtrend extending significantly below $2.00.
Technical outlook: XRP consolidates amid sideways trading
XRP is trading at around $2,19 at the time of writing on Friday while holding beneath the falling 50-day Exponential Moving Average (EMA) at $2.36, the 100-EMA and 200-day EMAs at $2.51, all of which cap the immediate upside. The Moving Average Convergence Divergence (MACD) has turned higher above the signal line on the daily chart, with a widening positive histogram suggesting momentum is improving and a recovery attempt could extend if resistance at $2.36 gives way.
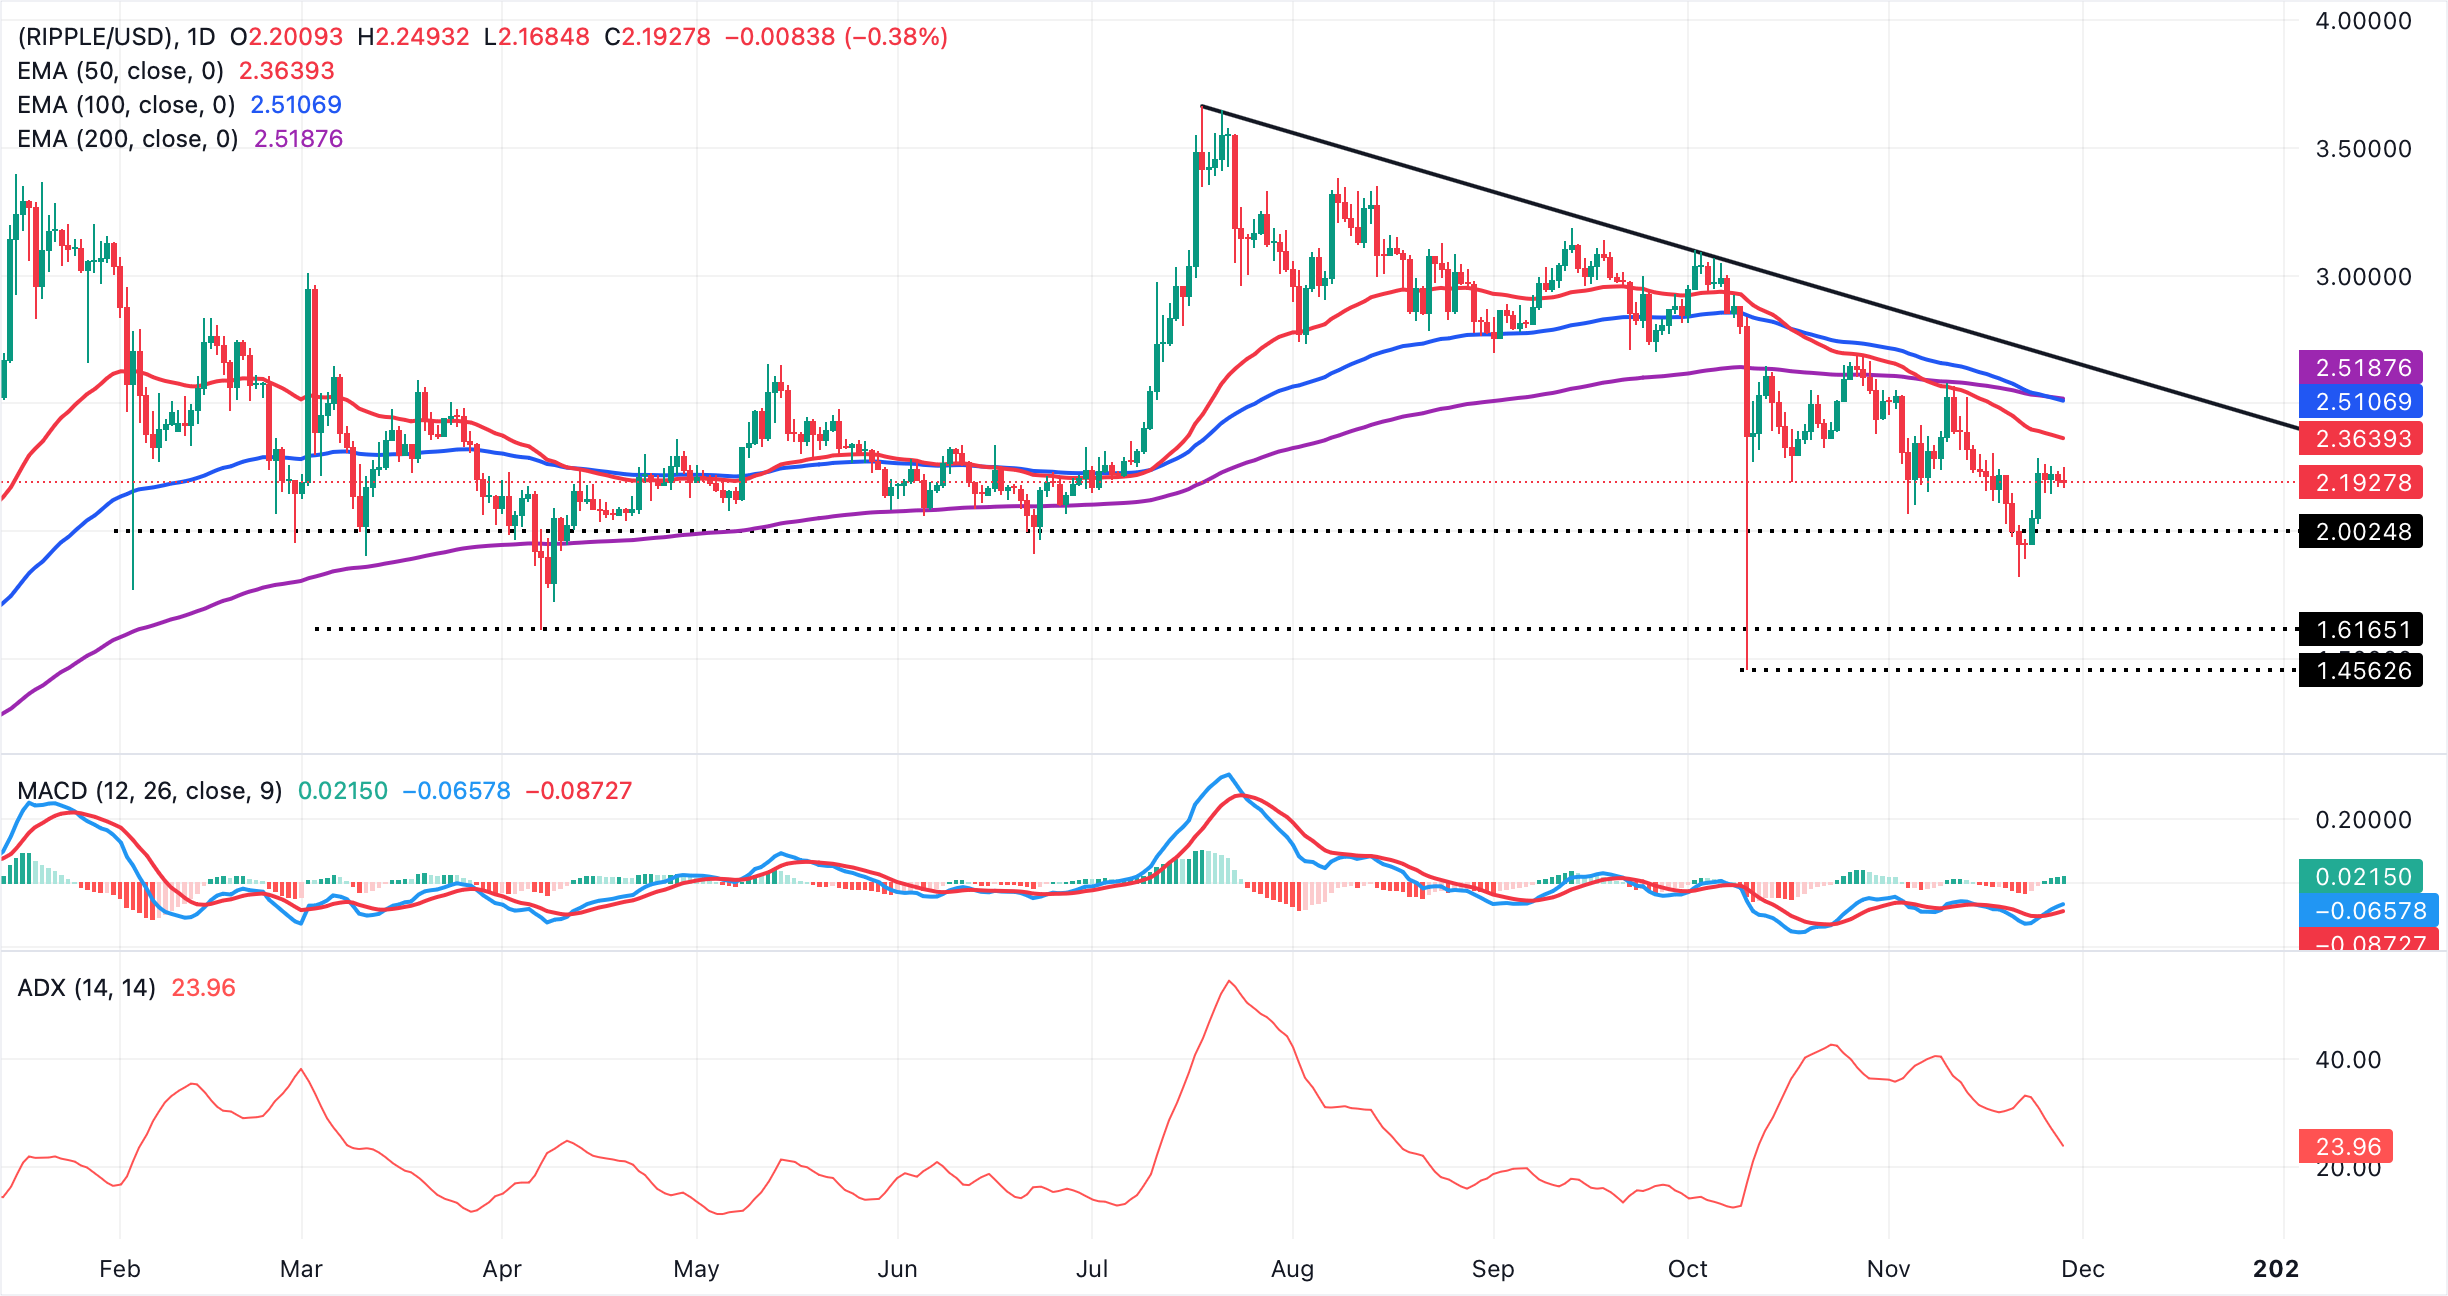
The descending trend line from $3.66, which marked the record high on July 18, continues to limit advances, with resistance seen at $2.66. Furthermore, the Average Directional Index (ADA) has eased to 23.96, reinforcing a waning trend and a consolidative tone. A break above the resistance cluster at the 100- and 200-day EMAs ($2.51), would strengthen the upside case, while failure ahead of the 50-day EMA at $2.36 would keep sellers in control.
Cryptocurrency metrics FAQs
The developer or creator of each cryptocurrency decides on the total number of tokens that can be minted or issued. Only a certain number of these assets can be minted by mining, staking or other mechanisms. This is defined by the algorithm of the underlying blockchain technology. On the other hand, circulating supply can also be decreased via actions such as burning tokens, or mistakenly sending assets to addresses of other incompatible blockchains.
Market capitalization is the result of multiplying the circulating supply of a certain asset by the asset’s current market value.
Trading volume refers to the total number of tokens for a specific asset that has been transacted or exchanged between buyers and sellers within set trading hours, for example, 24 hours. It is used to gauge market sentiment, this metric combines all volumes on centralized exchanges and decentralized exchanges. Increasing trading volume often denotes the demand for a certain asset as more people are buying and selling the cryptocurrency.
Funding rates are a concept designed to encourage traders to take positions and ensure perpetual contract prices match spot markets. It defines a mechanism by exchanges to ensure that future prices and index prices periodic payments regularly converge. When the funding rate is positive, the price of the perpetual contract is higher than the mark price. This means traders who are bullish and have opened long positions pay traders who are in short positions. On the other hand, a negative funding rate means perpetual prices are below the mark price, and hence traders with short positions pay traders who have opened long positions.
(The technical analysis of this story was written with the help of an AI tool)
Nothing in this material constitutes investment advice, personal recommendation, investment research, an offer, or a solicitation to buy or sell any financial instrument. The content has been prepared without consideration of your individual investment objectives, financial situation, or needs, and should not be treated as such.
Past performance is not a reliable indicator of future performance and/or results. Forward-looking scenarios or forecasts are not a guarantee of future performance. Actual results may differ materially from those anticipated.
Mitrade makes no representation or warranty as to the accuracy or completeness of the information provided and accepts no liability for any loss arising from reliance on such information.
Recommended Articles


