CFDs are complex instruments and come with a high risk of losing money rapidly due to leverage. 74% of retail investor accounts lose money when trading CFDs with this provider. You should consider whether you understand how CFDs work and whether you can afford to take the high risk of losing your money.

BNB price Forecast: Prolonged correction signals deeper bearish momentum

Source Fxstreet
  • BNB price extends correction on Wednesday, posting six consecutive red candlesticks.
  • Derivatives metrics back the bearish sentiment as BNB’s funding rates turn negative alongside rising short bets.
  • The technical outlook suggests a deeper correction as bears remain in control of momentum.

BNB (BNB), formerly known as Binance Coin, is trading below $618 on Wednesday, marking the sixth consecutive day of correction since the weekend. The bearish price action is further supported by rising short bets alongside negative funding rates in the derivatives market. Meanwhile, technical analysis suggests a deeper correction for BNB, as bears retain momentum.

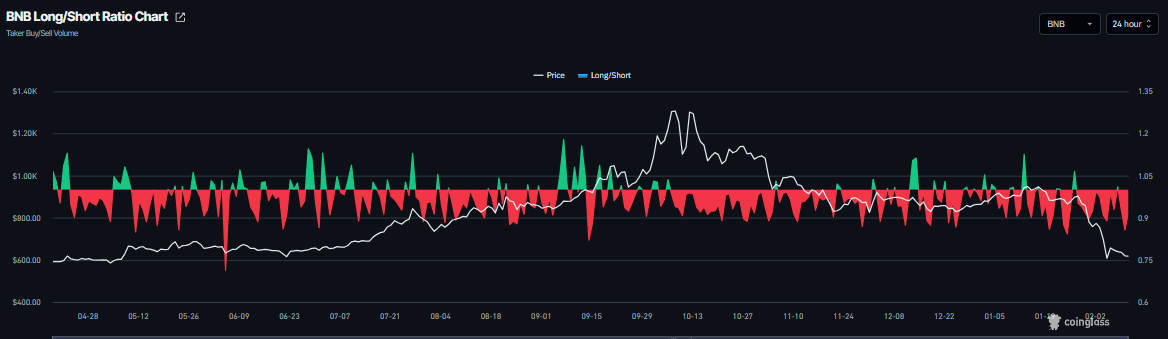
BNB’s derivatives market looks bearish

BNB’s derivatives data shows a bearish outlook. CoinGlass long-to-short ratio for BNB reads 0.91 on Wednesday. This ratio, which is below 1, indicates weakening market sentiment, as more traders are betting on BNB’s price to fall.

BNB long-to-short ratio chart. Source: Coinglass

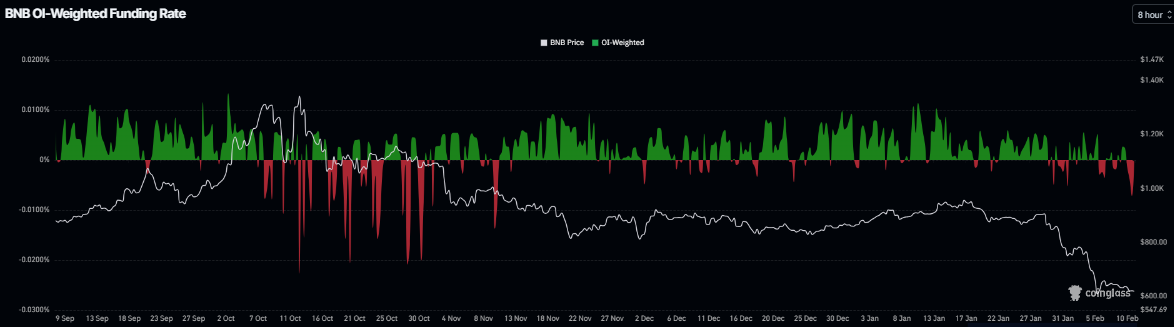
CoinGlass’s OI-Weighted Funding Rate data shows that the number of traders betting that the price of BNB will slide further is higher than those anticipating a price increase.

The metric flipped to a negative rate on Tuesday and currently stands at -0.0002% on Wednesday, indicating shorts are paying longs and suggesting bearish sentiment toward BNB.

BNB funding rate chart. Source: Coinglass

BNB Price Forecast: BNB bears aiming for lower lows

BNB price corrected sharply last week, reaching a low of $570.06 on Friday before recovering slightly, then resumed its decline, closing the week with a 15.64% loss. BNB extends its pullback, sliding nearly 4% through Wednesday.

If BNB continues its downward trend, it could extend the decline toward Friday’s low of $570.06. A close below this level could extend losses toward the next key psychological level at $550.

The Relative Strength Index (RSI) on the daily chart reads 24, below the oversold conditions, indicating strong bearish momentum. In addition, the Moving Average Convergence Divergence (MACD) showed a bearish crossover on January 20, which remains intact, further supporting the negative outlook.

BNB/USDT daily chart

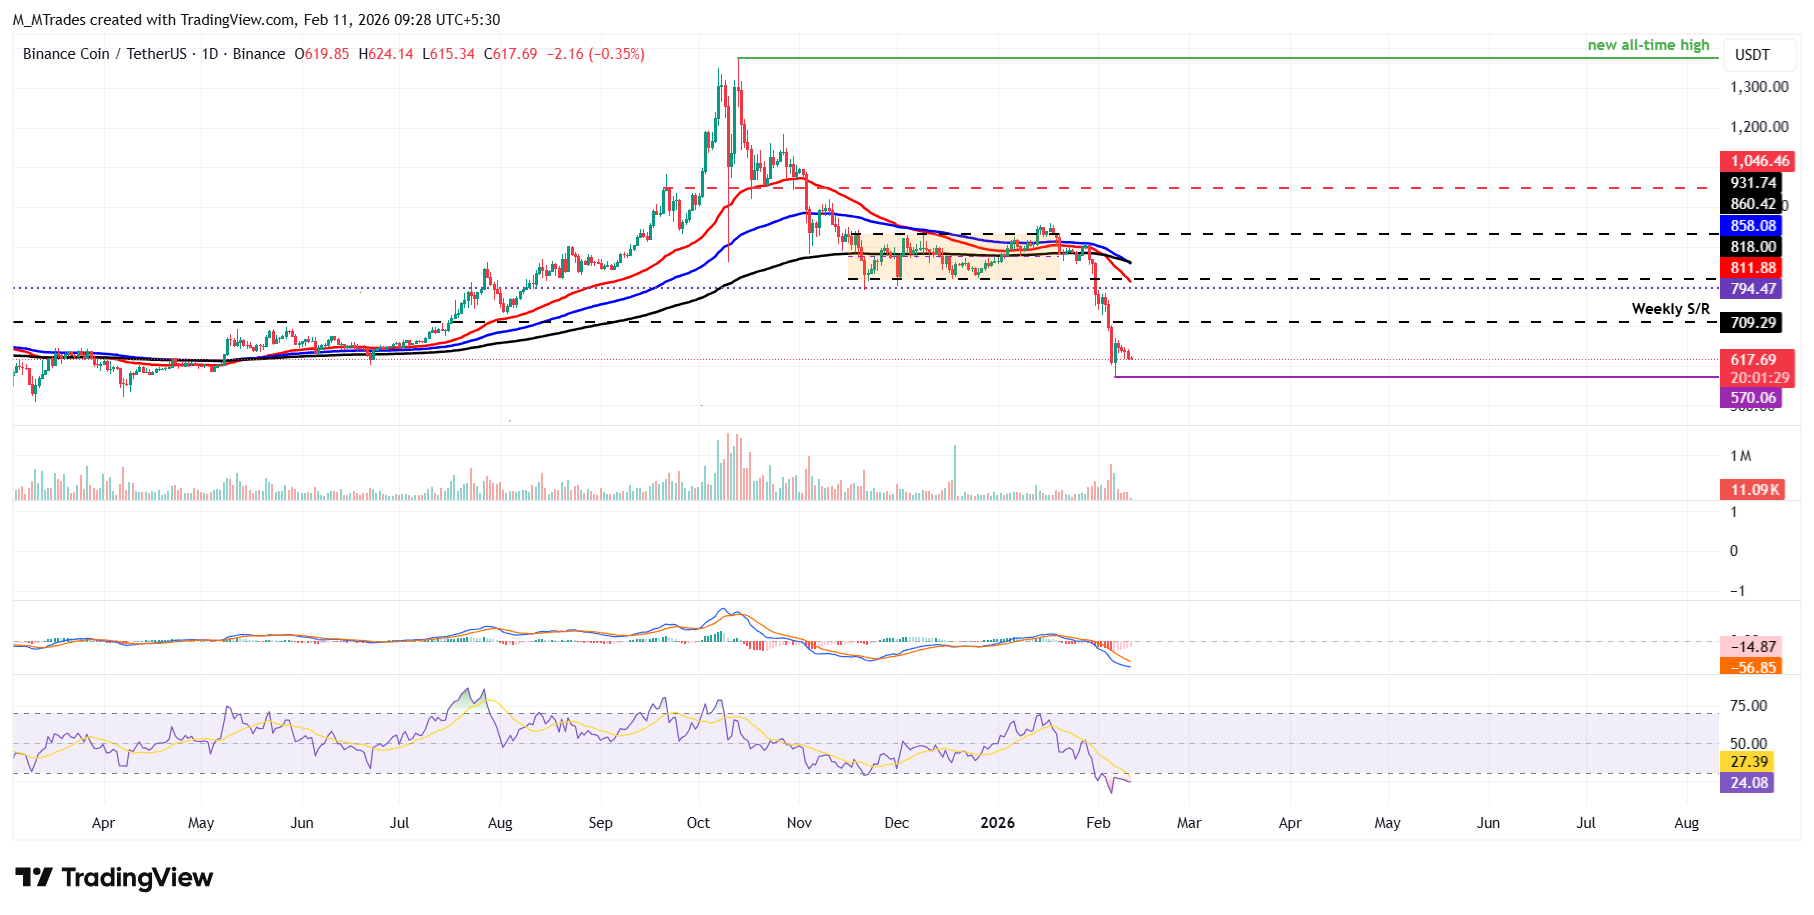
If BNB recovers, it could extend the advance toward the weekly resistance level at $709.29.

Disclaimer: The content available on Mitrade Insights is provided for informational and marketing purposes only. It has not been prepared in accordance with legal requirements designed to promote the independence of investment research and is not subject to any prohibition on dealing ahead of the dissemination of investment research
Nothing in this material constitutes investment advice, personal recommendation, investment research, an offer, or a solicitation to buy or sell any financial instrument. The content has been prepared without consideration of your individual investment objectives, financial situation, or needs, and should not be treated as such.
Past performance is not a reliable indicator of future performance and/or results. Forward-looking scenarios or forecasts are not a guarantee of future performance. Actual results may differ materially from those anticipated.
Mitrade makes no representation or warranty as to the accuracy or completeness of the information provided and accepts no liability for any loss arising from reliance on such information.
placeholder
Bitcoin Open Interest Plunges: Derivatives 'Flush Out' May Signal Major BottomBitcoin open interest has seen its sharpest 30-day drop of the cycle, with 1.3 million BTC in futures wiped out as price falls over 30% from $126,000 — a deleveraging that analyst “Darkfost” says could mark a bottom if BTC can later reclaim the $90,000–$96,000 zone and revive the bull trend.
Author  Mitrade
Nov 24, 2025
Bitcoin open interest has seen its sharpest 30-day drop of the cycle, with 1.3 million BTC in futures wiped out as price falls over 30% from $126,000 — a deleveraging that analyst “Darkfost” says could mark a bottom if BTC can later reclaim the $90,000–$96,000 zone and revive the bull trend.
placeholder
Pi Network Price Forecast: Whale Accumulation and Technical Confluence Put PI on Breakout WatchPi Network trades higher near a key $0.247 resistance zone, with whale accumulation, a 50-day EMA/Fibonacci confluence and bullish RSI–MACD signals all putting PI on breakout watch as long as weekly support at $0.221 holds.
Author  Mitrade
Nov 24, 2025
Pi Network trades higher near a key $0.247 resistance zone, with whale accumulation, a 50-day EMA/Fibonacci confluence and bullish RSI–MACD signals all putting PI on breakout watch as long as weekly support at $0.221 holds.
placeholder
Pi Network Price Forecast: PI falls as December token unlock overshadows gaming partnershipPi Network (PI) is down 4% by press time on Friday, after three days of an uptrend fueled by the CiDi Games partnership announcement on Wednesday.
Author  FXStreet
Nov 28, 2025
Pi Network (PI) is down 4% by press time on Friday, after three days of an uptrend fueled by the CiDi Games partnership announcement on Wednesday.
placeholder
GBP/USD Price Forecast: Softens below 1.3500 but retains positive technical outlookThe GBP/USD pair loses momentum near 1.3485 during the early European session on Monday, pressured by renewed US Dollar (USD) demand. The potential downside for a major pair might be limited, as the Bank of England (BoE) guided that monetary policy will remain on a gradual downward path.
Author  FXStreet
Dec 29, 2025
The GBP/USD pair loses momentum near 1.3485 during the early European session on Monday, pressured by renewed US Dollar (USD) demand. The potential downside for a major pair might be limited, as the Bank of England (BoE) guided that monetary policy will remain on a gradual downward path.
placeholder
WTI drops below $64.00, Middle East tensions in focusWest Texas Intermediate (WTI), the US crude oil benchmark, is trading around $63.80 during the early Asian trading hours on Tuesday. The WTI price falls as concerns about supply disruptions in the Middle East have faded.
Author  FXStreet
Feb 10, Tue
West Texas Intermediate (WTI), the US crude oil benchmark, is trading around $63.80 during the early Asian trading hours on Tuesday. The WTI price falls as concerns about supply disruptions in the Middle East have faded.
Related Instrument
goTop
quote