

Meme Coins Price Prediction: DOGE nears breakout, SHIB tests resistance, PEPE extends recovery
- Dogecoin approaches a crucial resistance level where a breakout could trigger a rally ahead.
- Shiba Inu is near a key resistance zone at $0.0000060, with a firm close above suggesting an upside move.
- Pepe price extends gains after finding support around the 50-day EMA at $0.0000036.
Dogecoin (DOGE), Shiba Inu (SHIB), and Pepe (PEPE) are showing renewed strength on Tuesday as bullish technical setups continue to build across major meme coins. DOGE and SHIB are near key resistance zones, where a firm close above would signal further upside move. Meanwhile, PEPE extends its recovery after finding cushion around its crucial support near the 50-day EMA, setting the stage for a potential rally continuation.
Dogecoin could extend gains if it closes above the 50-day EMA
Dogecoin price is nearing the key 50-day Exponential Moving Average (EMA) at $0.095 on Tuesday after gaining 2.35% the previous day. DOGE price has been consolidating below this resistance level for more than a month and recently broke above the zone last week, but failed to find support around it.
If DOGE closes above the $0.095 and holds strong, it could extend the rally toward the 100-day EMA at $0.105.
The Relative Strength Index (RSI) on the daily chart reads 52, pointing above the neutral level of 50, indicating fading bearish momentum. Moreover, the Moving Average Convergence Divergence (MACD) indicator on the same chart shows green histogram bars, supporting the positive outlook.
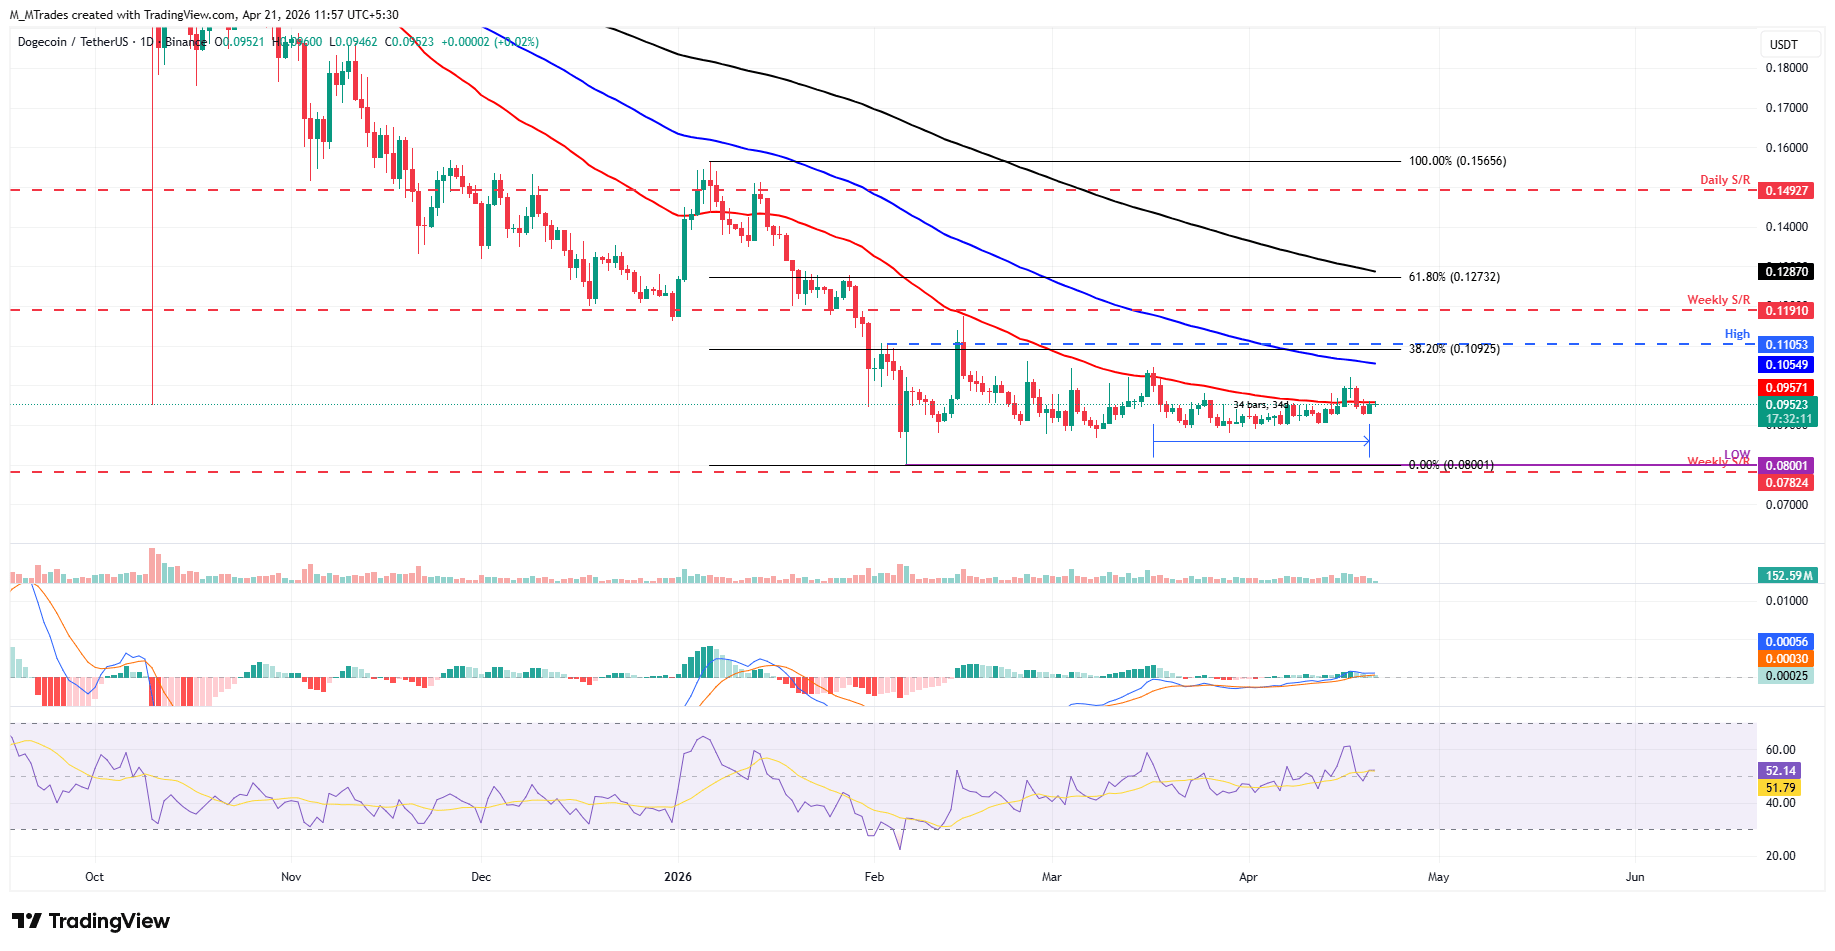
However, if DOGE fails to close above the 50-day EMA at $0.095 and corrects, it could extend the decline toward the February 6 low of $0.080.
Shiba Inu nears key resistance zone
Shiba Inu price is approaching the 50-day EMA at $0.0000060 on Tuesday, following a mild recovery the previous day. SHIB has been consolidating within the horizontal range of $0.0000056–$0.0000063 for more than a month.
If SHIB closes above the 50-day EMA at $0.0000060 on a daily basis, it could extend the rally toward the upper channel of consolidation at $0.0000063. A close above this level could extend further gains toward the 100-day EMA at $0.0000065.
Like Dogecoin, SHIB's RSI and MACD momentum indicators support a slight positive bias.
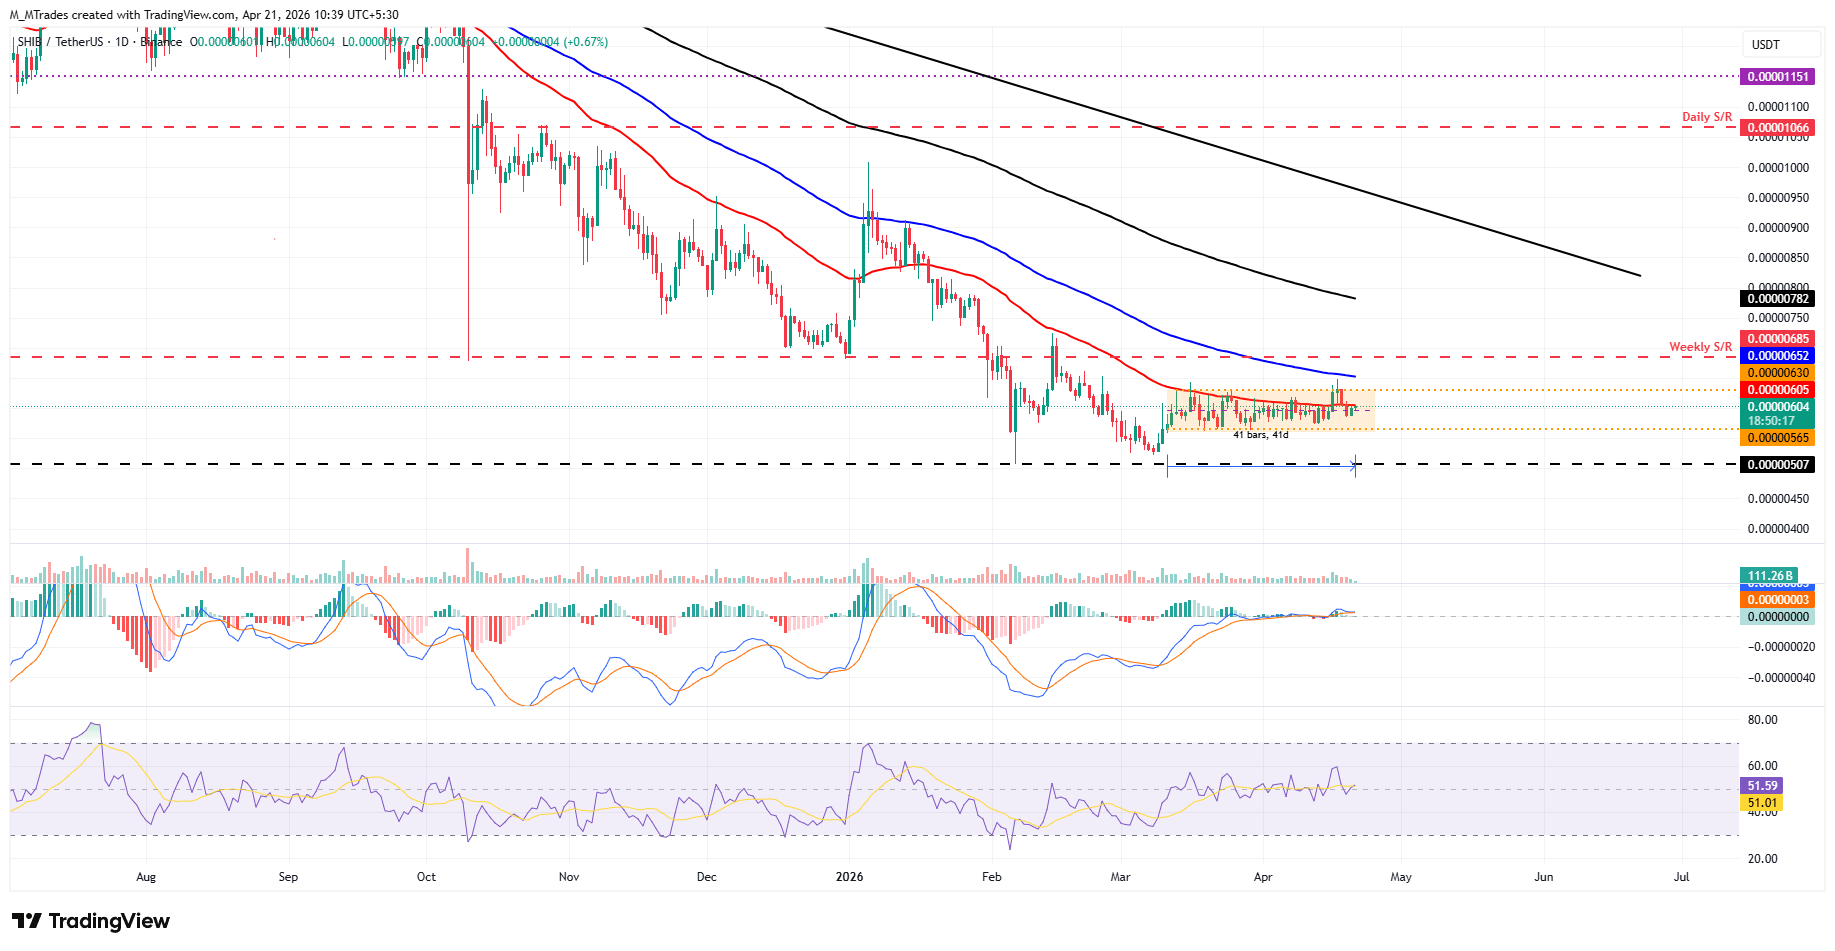
If SHIB faces rejection and corrects, it could extend the decline toward the lower channel range at $0.0000056.
Pepe extends recovery after finding support at a key level
Pepe price is trading at $0.0000037 on Tuesday after finding support and rebounding 3% from its previously broken 50-day EMA at $0.0000036. Moreover, the PEPE price broke above the descending trendline (drawn by joining multiple highs since early October) last week and has remained above it since then.
If PEPE continues its recovery, it could extend the rally toward the 100-day EMA at $0.0000040. A successful close above this level could extend further gains toward the 200-day EMA at $0.0000052, which roughly coincides with the daily resistance.
Like Dogecoin and Shiba Inu, Pepe’s momentum indicators (RSI and MACD) also support a mild bullish outlook.
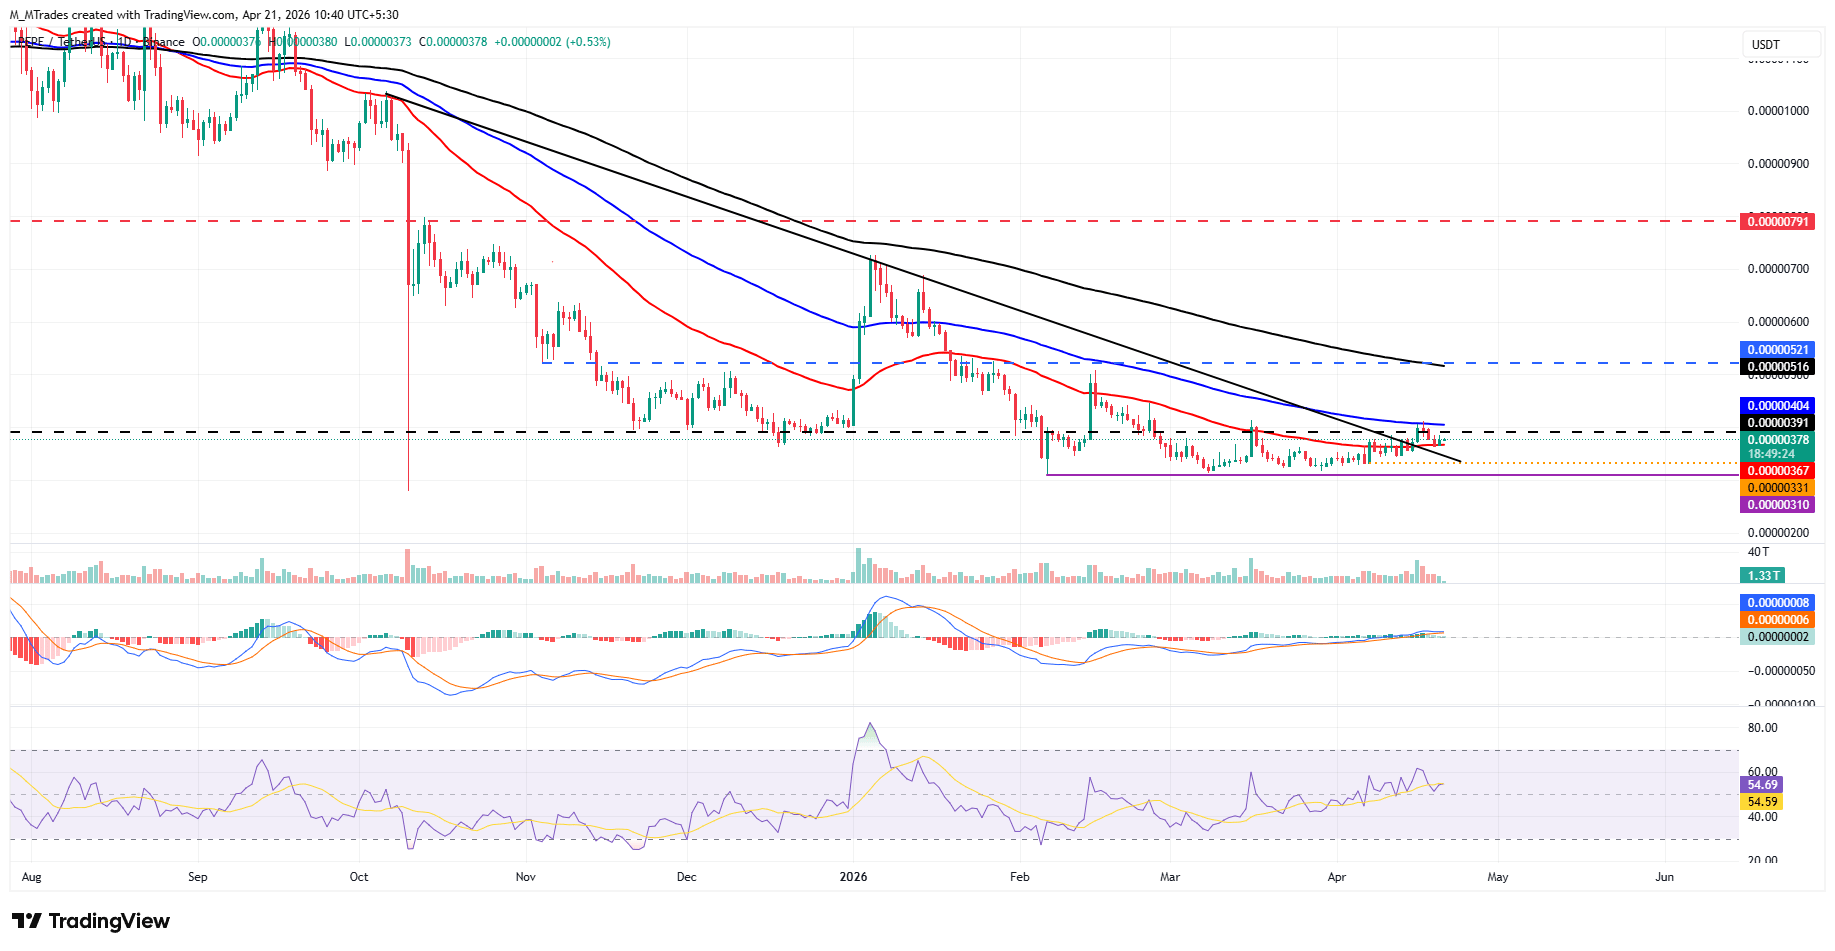
On the other hand, if PEPE faces a pullback, it could extend the decline toward the 50-day EMA at $0.0000036.
Nothing in this material constitutes investment advice, personal recommendation, investment research, an offer, or a solicitation to buy or sell any financial instrument. The content has been prepared without consideration of your individual investment objectives, financial situation, or needs, and should not be treated as such.
Past performance is not a reliable indicator of future performance and/or results. Forward-looking scenarios or forecasts are not a guarantee of future performance. Actual results may differ materially from those anticipated.
Mitrade makes no representation or warranty as to the accuracy or completeness of the information provided and accepts no liability for any loss arising from reliance on such information.
Recommended Articles


