

Bitcoin Weekly Forecast: Two months down and two months up, what's next?
- Bitcoin extends its rebound on Friday after a mild correction earlier this week.
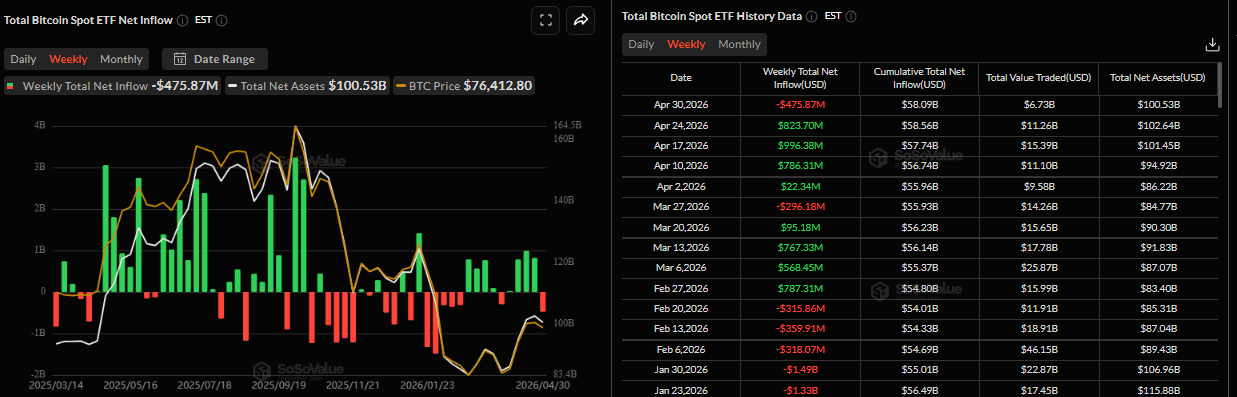
- US-listed spot ETF recorded an outflow of $475.87 million through Thursday, pointing to a break in the streak of four consecutive weekly inflows.
- The outcome from the Fed’s decision and uncertainty surrounding the Middle East conflict dampen risk appetite, limiting BTC’s upward momentum.
Bitcoin (BTC) price is extending its recovery, trading above $77,400 on Friday after a mild pullback earlier this week. However, institutional demand shows cautious signs as the spot Exchange records an outflow through Thursday amid the Federal Reserve’s (Fed) hawkish tone and uncertainty around the US-Iran peace talks, capping Crypto King upside momentum. Meanwhile, the optimism continues to build around the largest cryptocurrency by market capitalization as it closes the second month of positive returns.
Institutional investors remain cautious
Institutional demand has been cautious so far this week. SoSoValue data showed that the Bitcoin spot ETF recorded an outflow of $475.87 million through Thursday. If this outflow continues and intensifies on Friday, it would break the four consecutive weeks of inflows since early April, and BTC could extend its short-term correction.
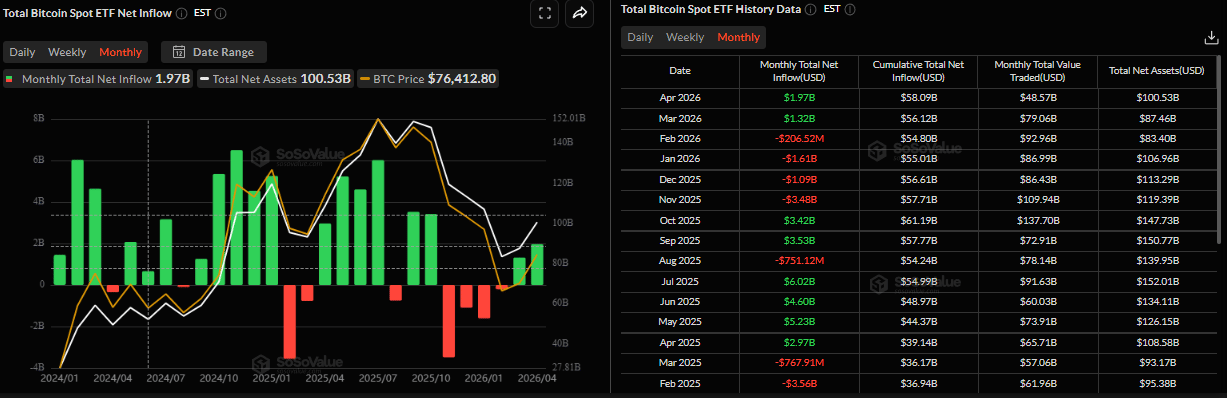
However, on the monthly chart, BTC has recorded a total net inflow of $1.97 billion in April, marking the second consecutive month of inflows. If this inflow trend continues in May, BTC could see a rally in the upcoming weeks.
On the corporate side, BTC demand remains robust. Michael Saylor announced on X on Monday that his firm, Strategy (MSTR), had purchased another 3,273 BTC for $255 million to add it to its reserves. The firm continues its aggressive accumulation spree, bringing the total holdings to 818,334 BTC, despite its $14.46 billion unrealized loss on its Bitcoin holdings for Q1 and the ongoing conflict between the US and Iran.
Macro headwinds and geopolitical tensions cap BTC upside move
Bitcoin extended its correction mid-week, closing below $76,000 on Wednesday. This price pullback came amid the Fed’s hawkish tilt and the US-Iran stalemate, which favors the US Dollar (USD) bulls and keeps a lid on risk-sensitive assets such as BTC.
The Fed decided to keep the interest rate unchanged at the 3.50%-3.75% range at its April meeting on Wednesday, as widely expected by market participants. Notably, the decision saw the highest number of dissents since 1992, with three policymakers voting against the accommodative tone in the policy statement, while another one dissented in favor of a rate cut.
In the post-meeting press conference, the outgoing Fed Chair Jerome Powell clarified that the debate was about the neutrality of the tone and not the need to hike interest rates. Traders, however, sharply reduced bets on any further Fed easing in 2026 and are now pricing in an over 10% chance of a rate increase by December, as per the CME FedWatch tool.
The decision comes at a time when the war-driven surge in energy prices has been fueling inflationary concerns amid stalled US-Iran peace talks. Uncertainty over the second round of negotiations in the Middle East conflict has emerged as a short-term factor capping the upside momentum of risky assets, as geopolitical risks continue to dampen risk sentiment across markets.
However, the earnings report from big US tech companies on Thursday has provided a mild boost to crypto markets, with the Crypto King recovering slightly. As of Friday, BTC is extending its rebound above $77,000.
Where is BTC heading in May?
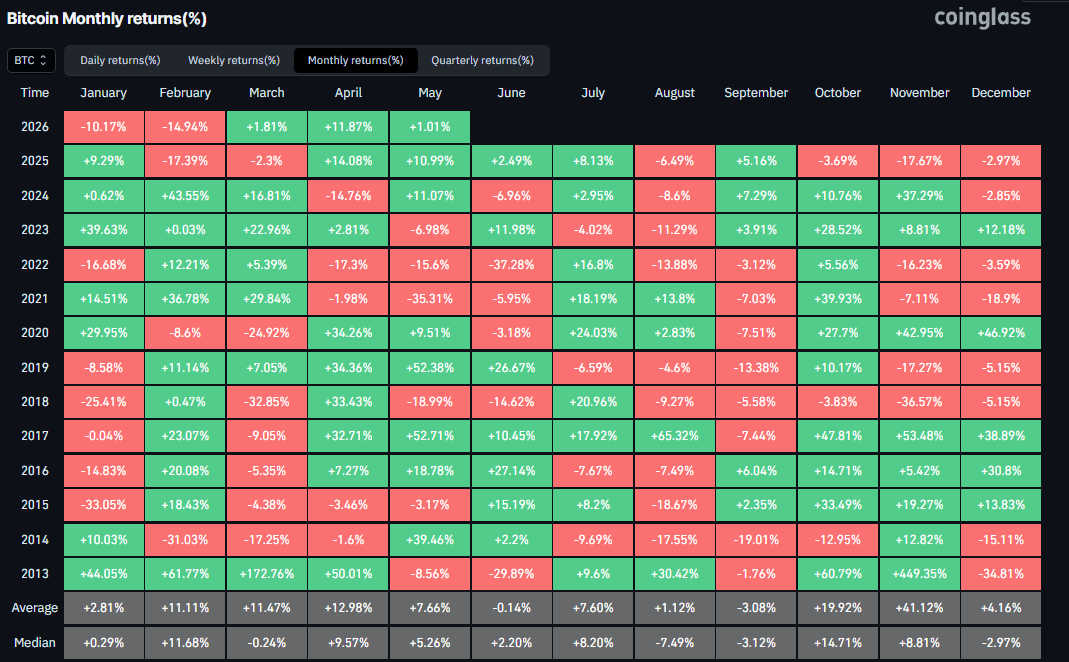
Bitcoin ended April on a positive note, extending its gains by over 11% and building on the mild positive return in March. Moreover, monthly trends suggest continued optimism. Historically, the Crypto King has delivered positive returns in May, averaging gains of 7.66%.
This recovery thesis would play in if institutional inflows continue, regulatory developments (such as the Clarity Act) turn supportive for the broader crypto market, and the war in the Middle East comes to an end, which could restore investor confidence and risk appetite.
Technical outlook: Bulls remain in control
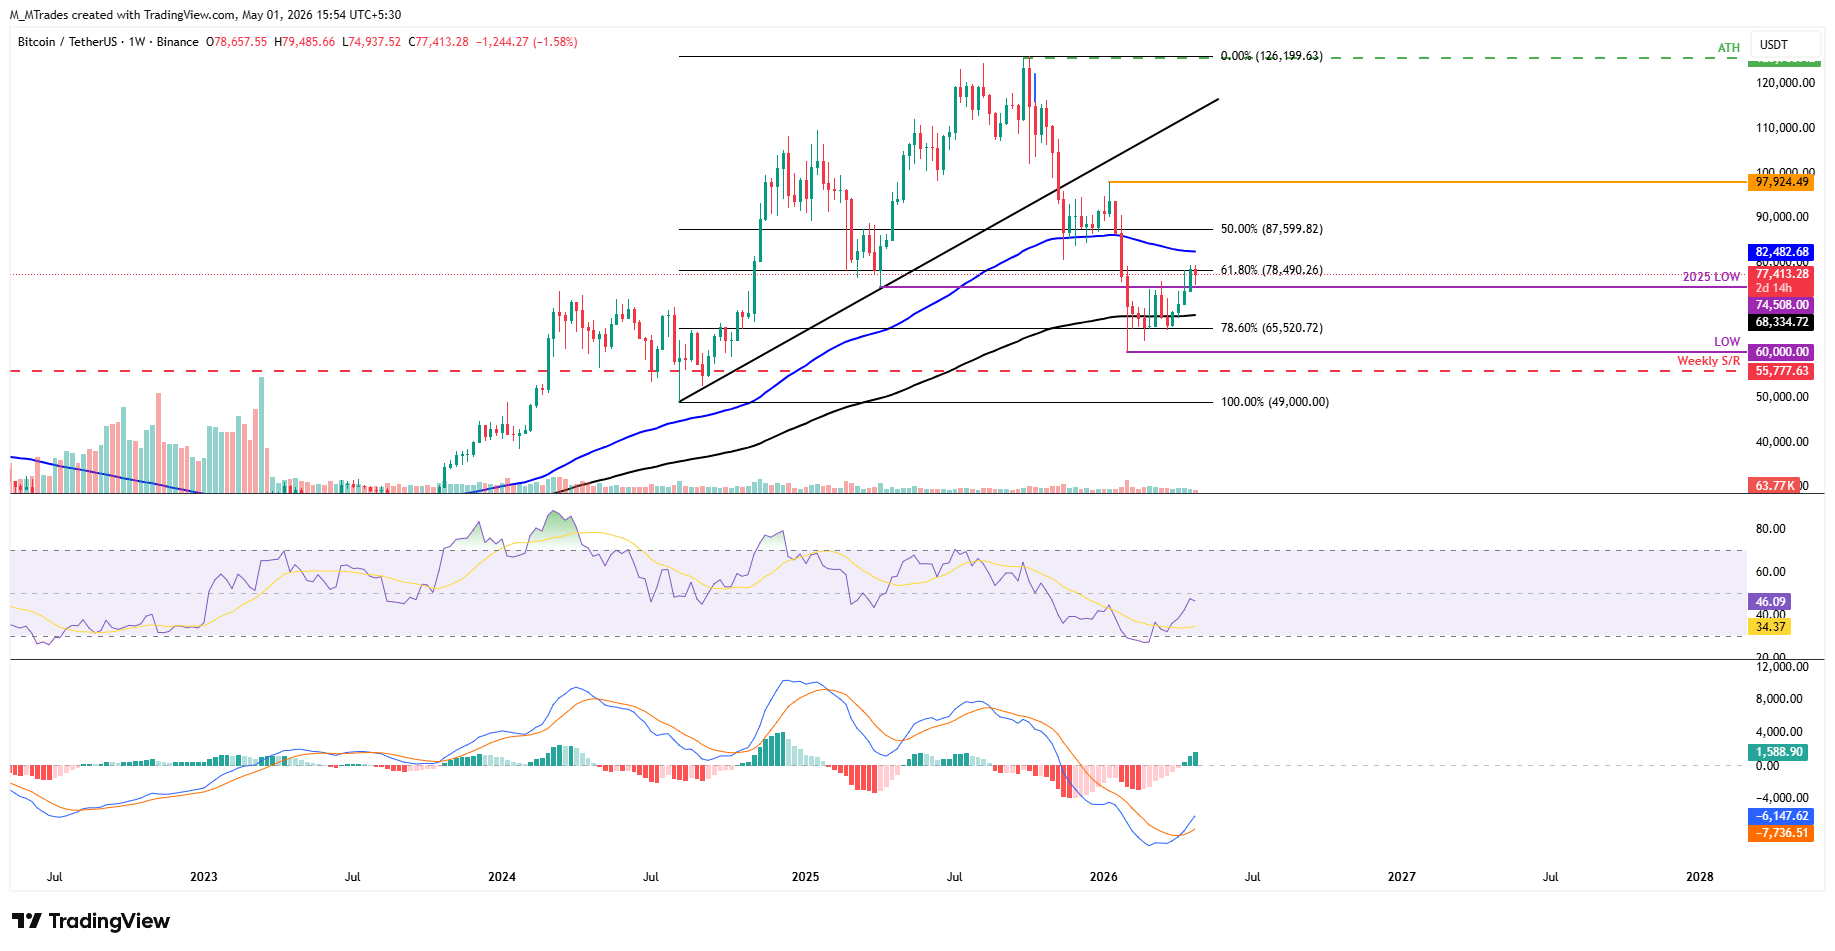
Bitcoin price rose more than 6% last week and closed above the 61.8% Fibonacci retracement level at $78,490 (drawn from the August 2024 low of $49,000 to the October 2025 all-time high of $126,199), the major resistance zone. As of the start of this week, BTC faces slight rejection, near the key $80,000 hurdle, and trades lower at $77,400 on Friday.
If BTC continues its upward move, it could extend the rally toward the the $80,000 psychological hurdle, and then toward the 100-week Exponential Moving Average (EMA) at $82,482.
The Relative Strength Index (RSI) on the weekly chart reads 46, nearing the neutral 50 level, suggesting fading bearish momentum. The Moving Average Convergence Divergence (MACD) indicator on the same chart showed a bullish crossover mid-April and remains intact, with a rising positive histogram supporting the bullish thesis.
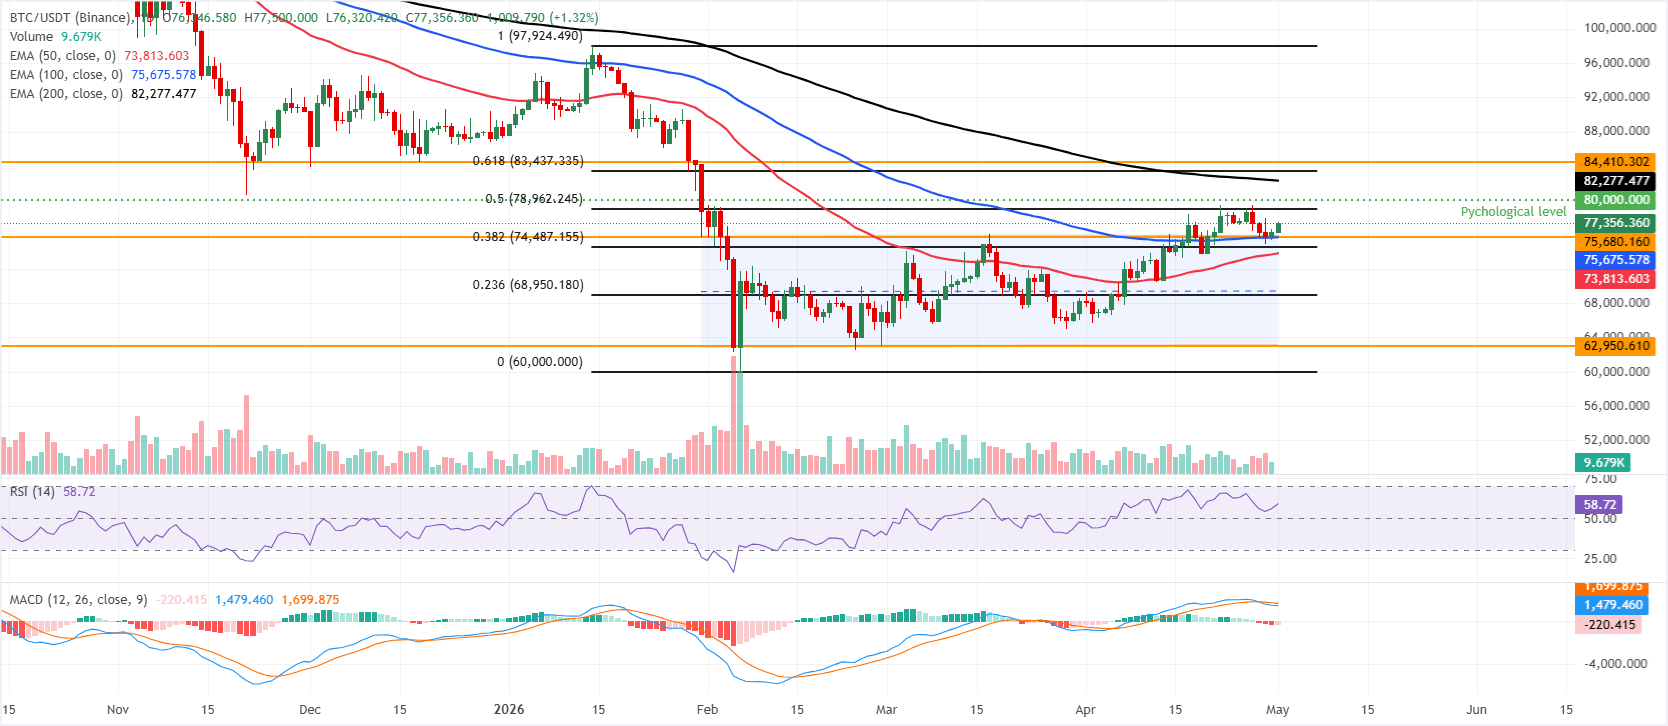
On the daily chart, the Crypto King is holding a bullish near-term bias as price sits above the 50-day and 100-day EMAs, clustered just under $75,700, and within the former channel top, now acting as immediate support around $75,680.
The RSI on the daily near 58 hints at constructive but not overextended momentum, while the negative MACD histogram below the zero line suggests upside is advancing against a still-soft broader momentum backdrop.
On the downside, initial support is seen at the former channel ceiling near $75,680 and the 100-day EMA at $75,675, with the 38.2% Fibonacci retracement (drawn from January high to February low) at $74,487 and the 50-day EMA around $73,813 reinforcing a deeper demand zone.
On the topside, the 50% retracement at $78,962 is the first notable resistance, ahead of the psychological $80,000 barrier, while the 200-day EMA near $82,277 and the 61.8% retracement around $83,437 converge below the horizontal cap at $84,410 to form a broader supply band that could limit the next leg higher.
(The technical analysis of this story was written with the help of an AI tool.)
Bitcoin, altcoins, stablecoins FAQs
Bitcoin is the largest cryptocurrency by market capitalization, a virtual currency designed to serve as money. This form of payment cannot be controlled by any one person, group, or entity, which eliminates the need for third-party participation during financial transactions.
Altcoins are any cryptocurrency apart from Bitcoin, but some also regard Ethereum as a non-altcoin because it is from these two cryptocurrencies that forking happens. If this is true, then Litecoin is the first altcoin, forked from the Bitcoin protocol and, therefore, an “improved” version of it.
Stablecoins are cryptocurrencies designed to have a stable price, with their value backed by a reserve of the asset it represents. To achieve this, the value of any one stablecoin is pegged to a commodity or financial instrument, such as the US Dollar (USD), with its supply regulated by an algorithm or demand. The main goal of stablecoins is to provide an on/off-ramp for investors willing to trade and invest in cryptocurrencies. Stablecoins also allow investors to store value since cryptocurrencies, in general, are subject to volatility.
Bitcoin dominance is the ratio of Bitcoin's market capitalization to the total market capitalization of all cryptocurrencies combined. It provides a clear picture of Bitcoin’s interest among investors. A high BTC dominance typically happens before and during a bull run, in which investors resort to investing in relatively stable and high market capitalization cryptocurrency like Bitcoin. A drop in BTC dominance usually means that investors are moving their capital and/or profits to altcoins in a quest for higher returns, which usually triggers an explosion of altcoin rallies.
Nothing in this material constitutes investment advice, personal recommendation, investment research, an offer, or a solicitation to buy or sell any financial instrument. The content has been prepared without consideration of your individual investment objectives, financial situation, or needs, and should not be treated as such.
Past performance is not a reliable indicator of future performance and/or results. Forward-looking scenarios or forecasts are not a guarantee of future performance. Actual results may differ materially from those anticipated.
Mitrade makes no representation or warranty as to the accuracy or completeness of the information provided and accepts no liability for any loss arising from reliance on such information.
Recommended Articles


