

Bitcoin Weekly Forecast: $82K rejection raises doubts over BTC rally durability
- Bitcoin price faces rejection near the key overhead supply near $82,000, holding a mild weekly gain as of Friday.
- US-listed spot ETF are set to post the sixth consecutive week of inflows.
- Uncertainty over the ceasefire in the Middle East and rising profit-taking activity cap BTC’s upside momentum.
Bitcoin (BTC) pauses its recent rally, trading below $80,000 on Friday with modest weekly gains, as it struggles to break above a key overhead supply zone. Institutional demand remains strong through Thursday, but rising geopolitical tensions in the Middle East and increasing profit-taking activity are capping further upside, leaving the Crypto King vulnerable to near-term pullbacks.
Institutional demand holds
Bitcoin price extended its rally in the first half of the week, climbing to a three-month high of $82,850 on Wednesday before encountering strong resistance at a key overhead supply zone. The price surge was supported by the strong institutional demand so far this week as well as improving risk sentiment over a possible peace agreement between the US and Iran.
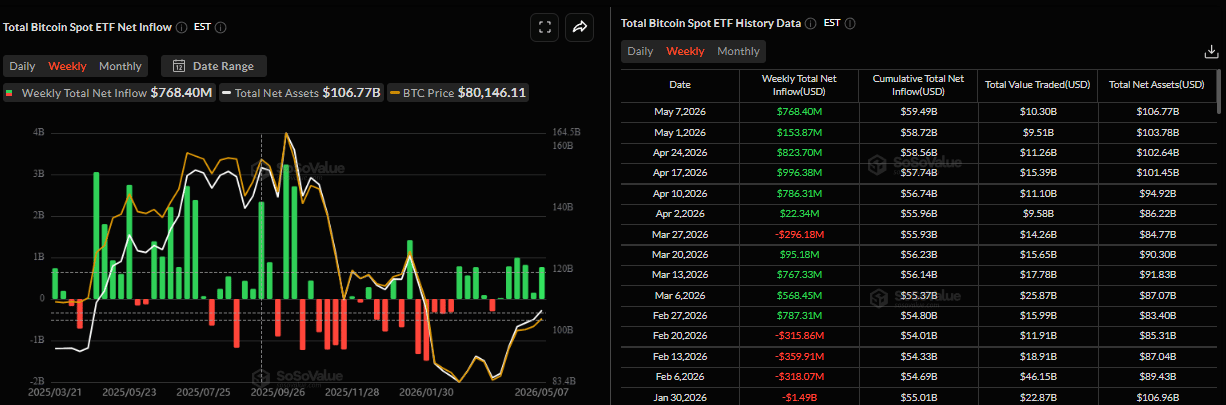
SoSovalue data shows that BTC spot Exchange Traded Funds (ETFs) record a net inflow of $768.40 million through Thursday. Unless Friday closes with very large outflows, US-listed Bitcoin ETFs are set for the sixth consecutive week of inflows, a positive streak that started in early April.
Traders locking in profit trigger price pullback
CryptoQuant’s weekly report on Thursday highlights that profit-taking activity in early May accelerated as Bitcoin hit a three-month high.
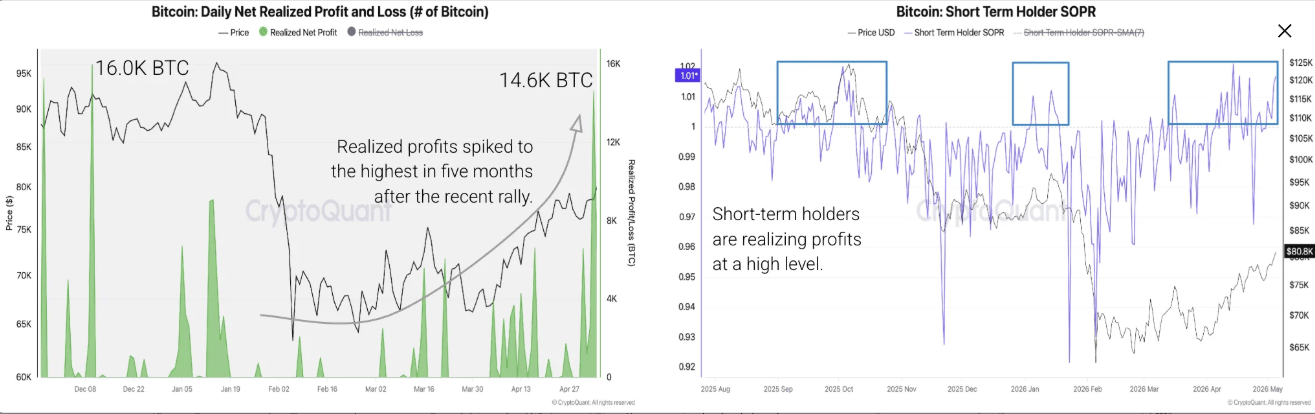
The chart below, on the left, shows that daily realized profits spiked to 14,600 BTC on Monday, the highest level since December 10, 2025, as the 27% rally from the April lows pushed holders back into profitable territory. Meanwhile, the Short-Term Holder (SOPR), shown below on the right, rose to 1.016 and has been in clear profit-taking territory continuously since mid-April, confirming that the recent price appreciation has prompted broad holder distribution.
“Historically, in bear markets, spikes in realized profits at key resistance levels precede local price tops or sustained consolidation phases,” noted the report.
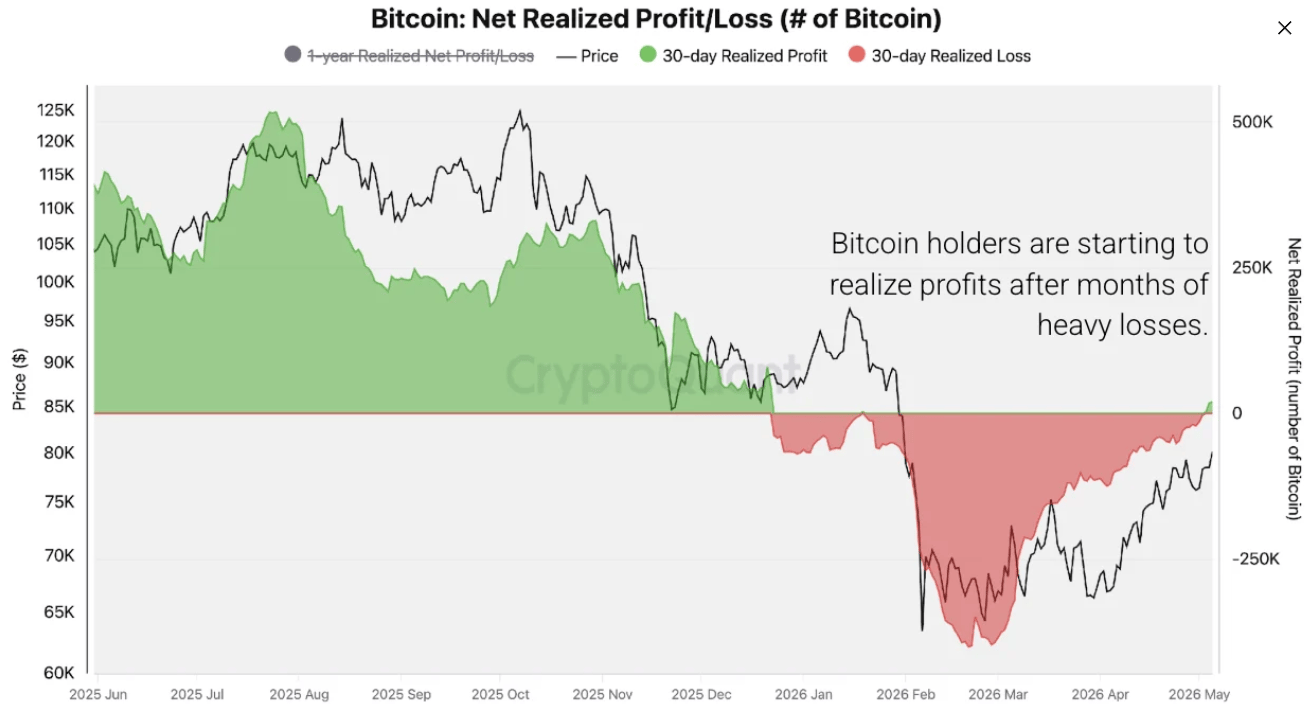
The report further explained that Bitcoin holders are realizing net profits of +20,000 BTC on a 30-day rolling basis, the first positive reading since December 22, 2025, following a period of heavy net losses in February and March that reached as deep as -398,000 BTC.
“At 20,000 BTC net profit, the magnitude remains well below the 130,000–200,000 BTC thresholds associated with confirmed bull market regime transitions and comparable to the net profit levels seen at the start of the March 2026 rally before prices corrected. This distinction reinforces the bear market rally classification rather than a structural regime change,” concluded CryptoQuant’s analyst.
Apart from this profit-taking activity, as explained in a previous report, the current BTC price surge is mostly driven by perpetual futures demand while spot markets remain in contraction.
Traders should be cautious as the current market structure is more speculative than fundamental, mirroring the pattern seen at the onset of the 2022 bear market.
Uncertainty keeps risk sentiment in check
Uncertainty in the Middle East remains high as the US and Iran exchanged fire late on Thursday. The Guardian reported that Iran accused the US of violating the ceasefire by targeting two ships at the Strait of Hormuz and attacking civilian areas, as Washington insisted it struck in retaliation. Trump said the ceasefire remains in place despite the strikes.
The US President Donald Trump administration has been waiting for Iran to respond to its proposal to reopen the Strait of Hormuz and end the war. Iran’s leaders haven’t indicated whether they’ll accept the terms of the deal, though they’ve previously shown little sign of yielding on their nuclear program and accepting a moratorium on enriching uranium.
The fresh wave of uncertainty dampened risk sentiment, causing risky assets such as Bitcoin to correct in the latter half of the week. Further escalation or intervention by the US or Iran during the weekend could further dampen risk appetite, leading to a further correction in BTC.
Technical outlook: Faces rejection near the overhead supply zone
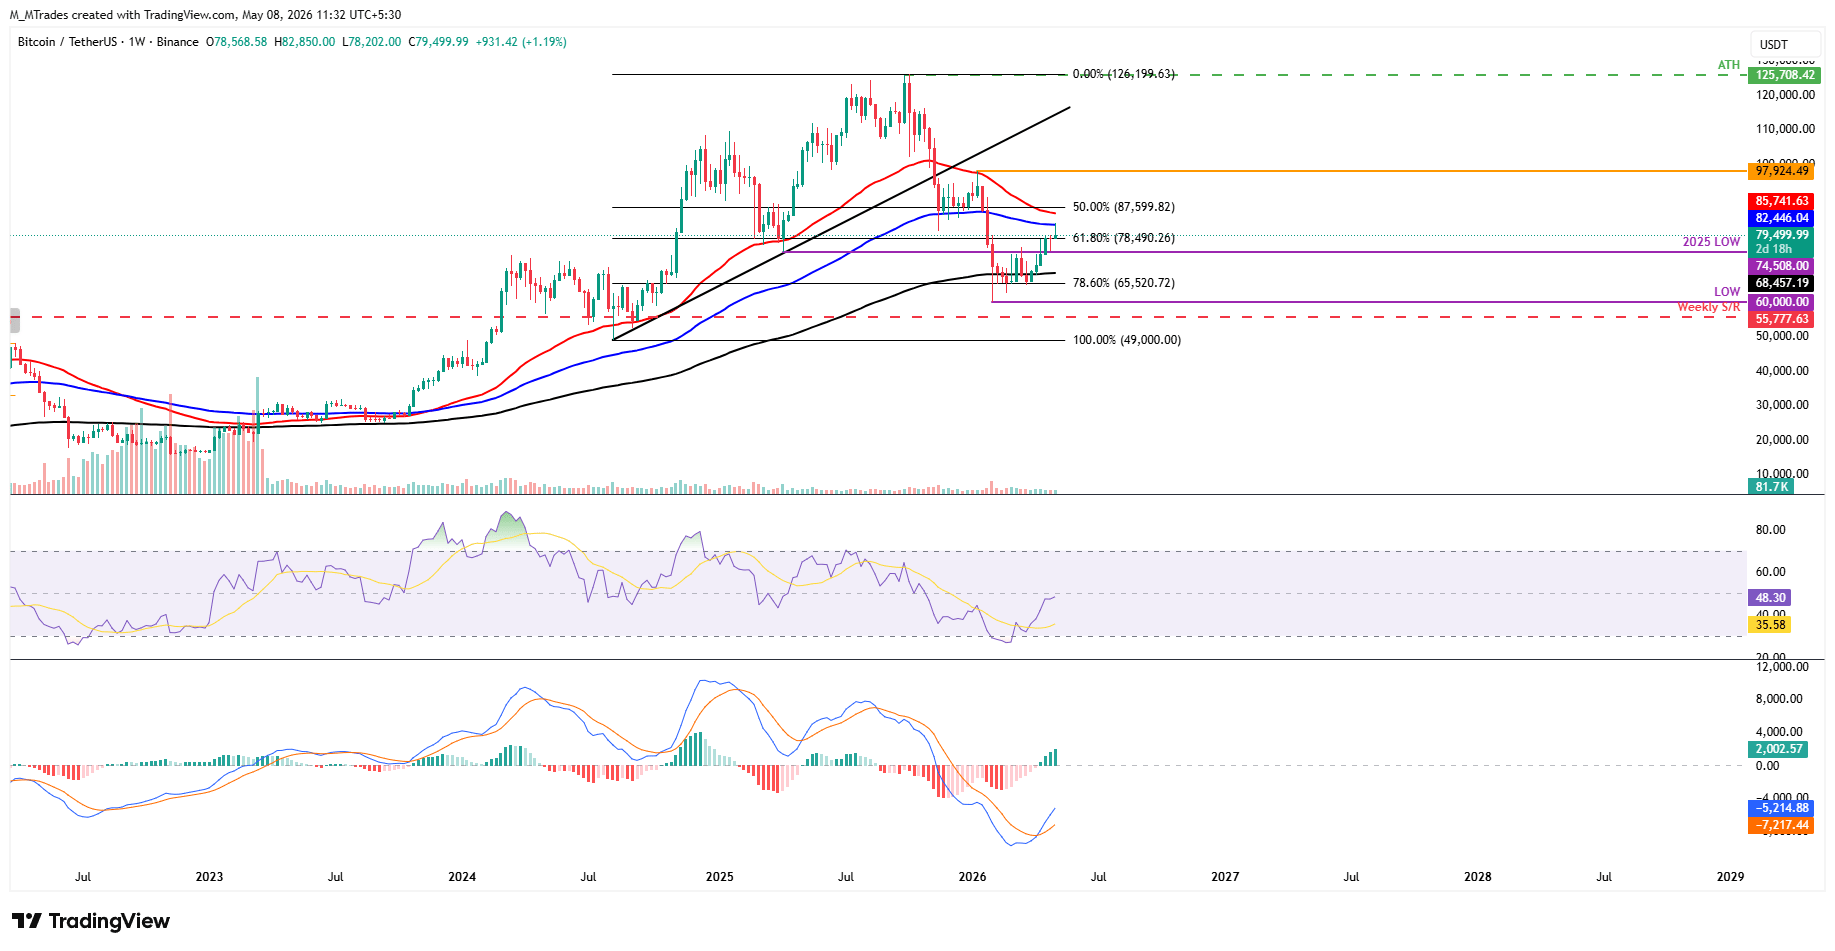
Bitcoin price surged to a three-month high of $82,850 midweek but faced rejection near the key 100-week Exponential Moving Average (EMA) at $82,446, which acted as overhead supply. Despite the pullback, BTC is still holding a modest weekly gain as of Friday’s writing.
If BTC continues its correction, it could extend the decline toward the key $80,000 psychological support. A slip below this level could extend the pullback toward the 61.8% Fibonacci retracement level at $78,490 (drawn from the October all-time high of $126,199 to the February low of $60,000).
Momentum is mixed but improving, with the Relative Strength Index (RSI) on the weekly chart hovering near a neutral 48 while the Moving Average Convergence Divergence (MACD) remains firmly positive, hinting that bullish pressure is attempting to reassert itself despite the recent consolidation.
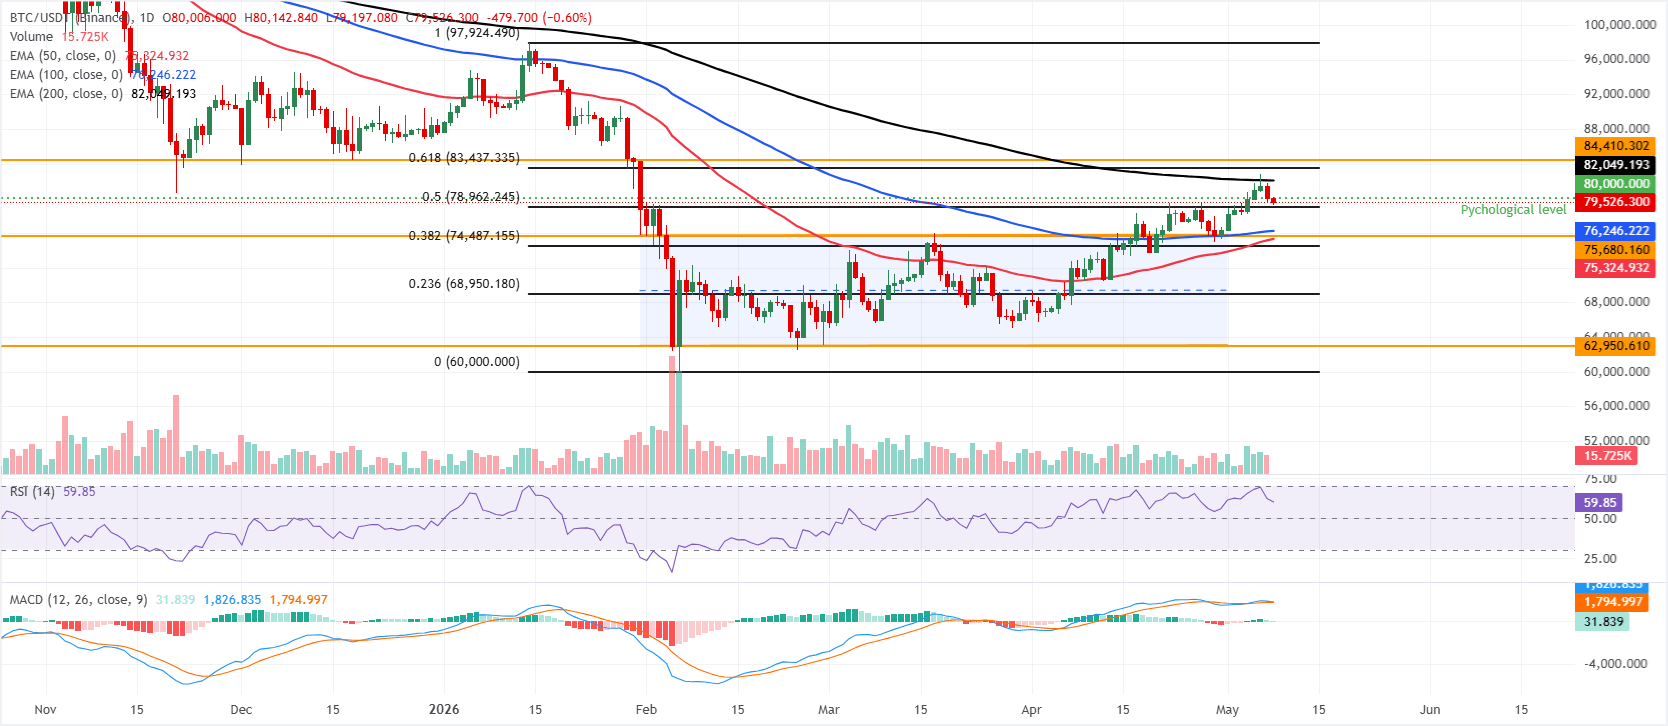
On the daily chart, the Crypto King was rejected by the 200-day EMA at $82,049, which roughly coincides with the 100-week EMA at $82,446 as explained above.
BTC is holding a bullish near-term bias, as price sits above the 50-day and 100-day EMAs, clustered around $75,300–$76,300, and comfortably above the 50% retracement (drawn from the January high to the February low) at $78,962.
The Crypto King, however, is capped by the horizontal barrier at $80,000, while the 200-day EMA is at $82,049 and the 61.8% Fibonacci level is at $83,437, forming a broader resistance band above.
Momentum remains constructive, with the Relative Strength Index (RSI) holding near 59 and the Moving Average Convergence Divergence (MACD) line still marginally positive, suggesting buyers retain control but with fading follow-through.
On the downside, initial support is now aligned at the reclaimed 50% retracement at $78,962, ahead of a dense demand zone where the 100-day EMA at $76,246 converges with the former channel top near $75,680, and the 50-day EMA at $75,324.
A break below this band would expose deeper retracements toward the 38.2% Fibonacci level at $74,487 and then the 23.6% Fibonacci retracement at $68,950. Sustained trade above $80,000 would open the way toward the 200-day EMA at $82,048 and the $84,410 resistance, with the January high near $97,924 remaining the broader bullish objective.
(The technical analysis of this story was written with the help of an AI tool.)
Bitcoin, altcoins, stablecoins FAQs
Bitcoin is the largest cryptocurrency by market capitalization, a virtual currency designed to serve as money. This form of payment cannot be controlled by any one person, group, or entity, which eliminates the need for third-party participation during financial transactions.
Altcoins are any cryptocurrency apart from Bitcoin, but some also regard Ethereum as a non-altcoin because it is from these two cryptocurrencies that forking happens. If this is true, then Litecoin is the first altcoin, forked from the Bitcoin protocol and, therefore, an “improved” version of it.
Stablecoins are cryptocurrencies designed to have a stable price, with their value backed by a reserve of the asset it represents. To achieve this, the value of any one stablecoin is pegged to a commodity or financial instrument, such as the US Dollar (USD), with its supply regulated by an algorithm or demand. The main goal of stablecoins is to provide an on/off-ramp for investors willing to trade and invest in cryptocurrencies. Stablecoins also allow investors to store value since cryptocurrencies, in general, are subject to volatility.
Bitcoin dominance is the ratio of Bitcoin's market capitalization to the total market capitalization of all cryptocurrencies combined. It provides a clear picture of Bitcoin’s interest among investors. A high BTC dominance typically happens before and during a bull run, in which investors resort to investing in relatively stable and high market capitalization cryptocurrency like Bitcoin. A drop in BTC dominance usually means that investors are moving their capital and/or profits to altcoins in a quest for higher returns, which usually triggers an explosion of altcoin rallies.
Nothing in this material constitutes investment advice, personal recommendation, investment research, an offer, or a solicitation to buy or sell any financial instrument. The content has been prepared without consideration of your individual investment objectives, financial situation, or needs, and should not be treated as such.
Past performance is not a reliable indicator of future performance and/or results. Forward-looking scenarios or forecasts are not a guarantee of future performance. Actual results may differ materially from those anticipated.
Mitrade makes no representation or warranty as to the accuracy or completeness of the information provided and accepts no liability for any loss arising from reliance on such information.
Recommended Articles


