



Cardano Price Forecast: Ongoing whale accumulation fails to halt downward correction
- Cardano price extends its losses on Monday after correcting more than 14% in the previous week.
- Santiment data show that whales continue to buy ADA, but their accumulation failed to lift the price.
- Bearish positioning in derivatives and a deteriorating technical outlook suggest the correction could continue.
Cardano (ADA) extends its losses, trading below $$0.160 on Monday after falling over 14% in the previous week. Despite on-chain data showing continued accumulation by whales, the buying activity has failed to lift prices. Meanwhile, bearish derivatives metrics and a weakening technical outlook indicate further downside for ADA.
Whales buy dips but fail to stop falling prices
Santiment’s Supply Distribution data shows that large-wallet holders (whales) are buying ADA during its recent price dips, a move that supports the positive outlook for the token.
The metric indicates that whales holding between 100,000 and 1 million ADA tokens (red line), 1 million and 10 million ADA tokens (yellow line), and 10 million and 100 million ADA tokens (blue line) have accumulated a total of 320 million ADA tokens since July 7. This buy-the-dip scenario signals continued long-term interest among large-wallet holders, suggesting a bullish outlook. However, in the short term, it failed to provide support.
 [09-1783918807188.26.22, 13 Jul, 2026].png)
Derivatives traders turn bearish
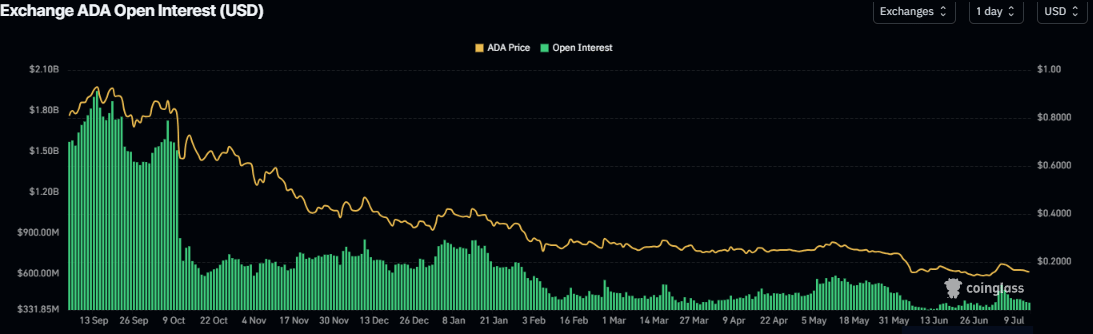
Derivatives metrics show a bearish bias for Cardano. ADA’s futures Open Interest (OI) dips to $385 million on Monday, having fallen steadily since a mild rise in early July and now remaining in a broder downward trend. The decline in OI alongside falling prices suggests a bearish outlook.
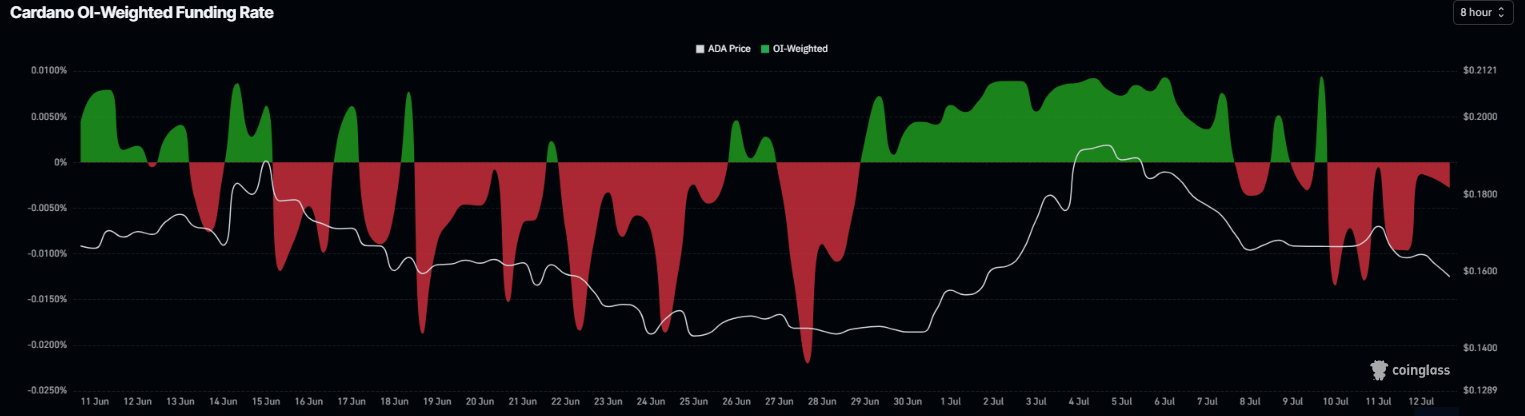
In addition, the funding rates data also supports a bearish outlook. CoinGlass’ OI-Weighted Funding Rate data for ADA flipped negative on Friday, reading -0.0028% on Monday. This negative rate indicates that shorts are paying longs and projects a bearish sentiment.
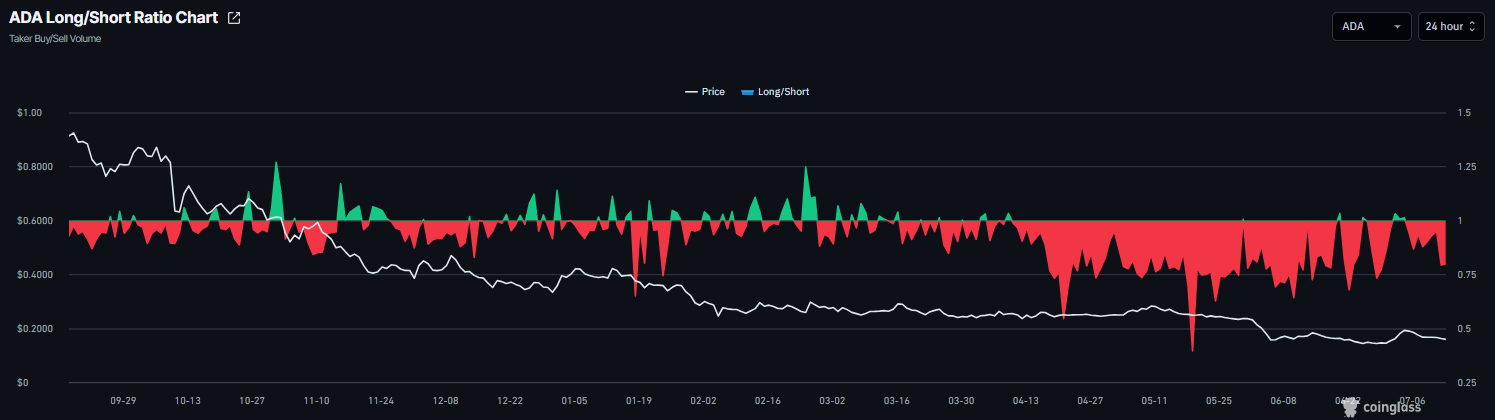
CoinGlass’ long-to-short ratio for ADA reads 0.79 on Monday, nearing its lowest level in over a month. This ratio, being below one, reflects bearish sentiment in the market, as more traders are betting on the asset’s price to fall.
Cardano Price Forecast: ADA extends losses
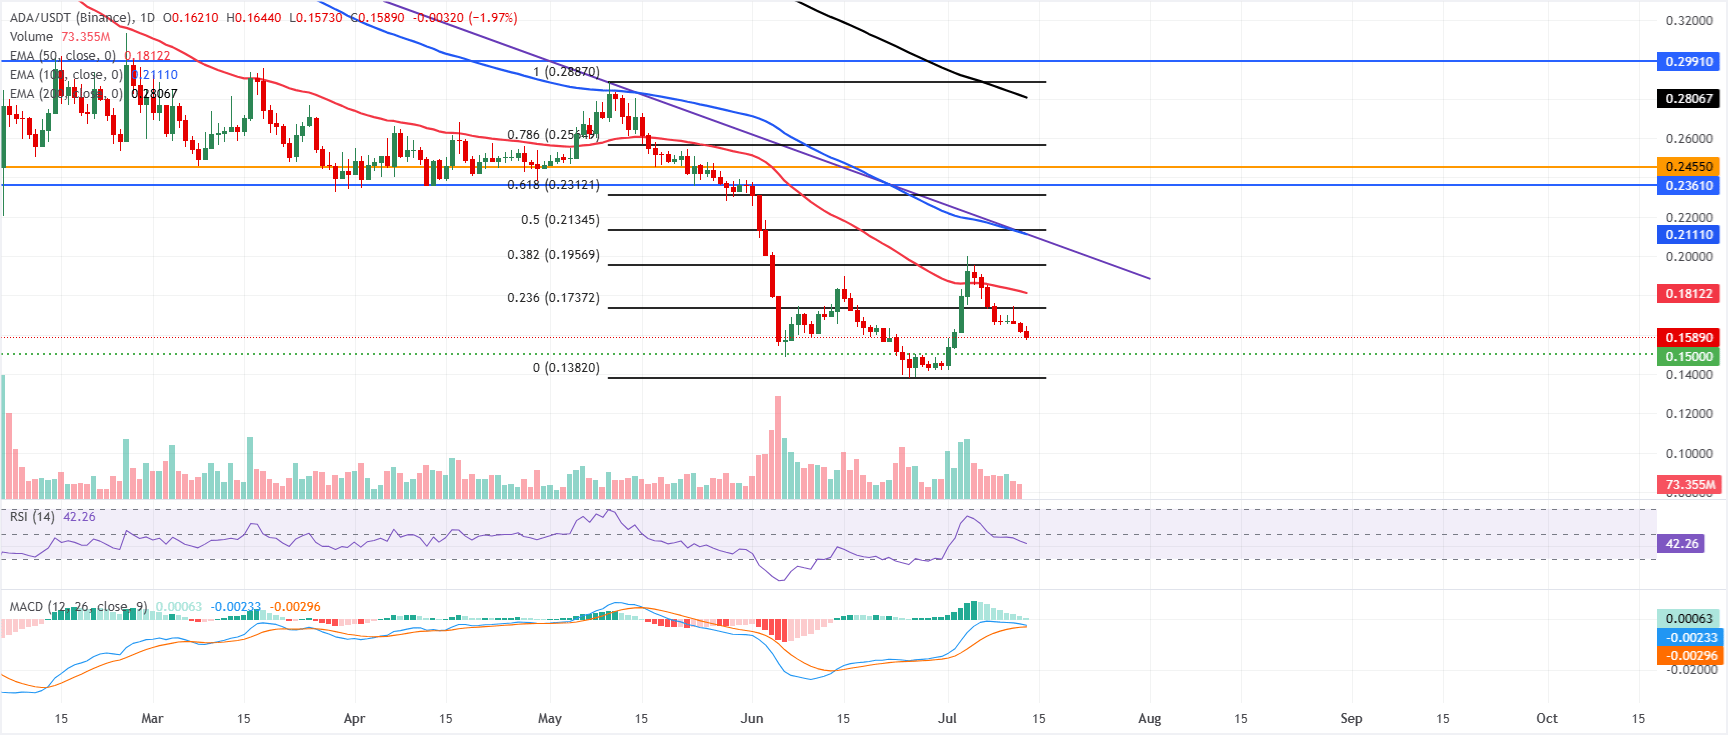
Cardano price trades at $0.158 on Monday after losses of over 14% in the previous week. ADA is keeping a bearish near-term bias as price holds well below the major Exponential Moving Averages (EMAs). The 50-day EMA at $0.181, the 100-day EMA and the broken descending trendline break zone clustered around $0.211, and the 200-day EMA at $0.280 all sit overhead as layered dynamic resistance.
Momentum signals are subdued, with the Relative Strength Index (RSI) hovering near 42 and the Moving Average Convergence Divergence (MACD) line fading toward the zero line, which together hint that any rebound is likely to face supply rather than mark a clean trend reversal.
On the topside, initial resistance emerges at the 23.6% Fibonacci retracement of the latest swing near $0.173, followed by the 50-day EMA near $0.181 and the 38.2% Fibonacci retracement near $0.195. Higher up, the confluence of the 100-day EMA and the prior trendline break area near $0.211 forms a pivotal cap ahead of static hurdles at $0.236 and $0.245, while $0.280 and $0.299 define a broader medium-term ceiling.
On the downside, immediate support is seen near the recent horizontal floor at $0.150, with the Fibonacci anchor around $0.138 acting as a deeper structural base should selling pressure resume.
(The technical analysis of this story was written with the help of an AI tool. Know more.)
Nothing in this material constitutes investment advice, personal recommendation, investment research, an offer, or a solicitation to buy or sell any financial instrument. The content has been prepared without consideration of your individual investment objectives, financial situation, or needs, and should not be treated as such.
Past performance is not a reliable indicator of future performance and/or results. Forward-looking scenarios or forecasts are not a guarantee of future performance. Actual results may differ materially from those anticipated.
Mitrade makes no representation or warranty as to the accuracy or completeness of the information provided and accepts no liability for any loss arising from reliance on such information.
Recommended Articles


