



Dogecoin Price Forecast: DOGE rally reclaims $0.10 as buying pressure mounts
- Dogecoin holds steady around $0.10 on Tuesday, following a 14% jump the previous day.
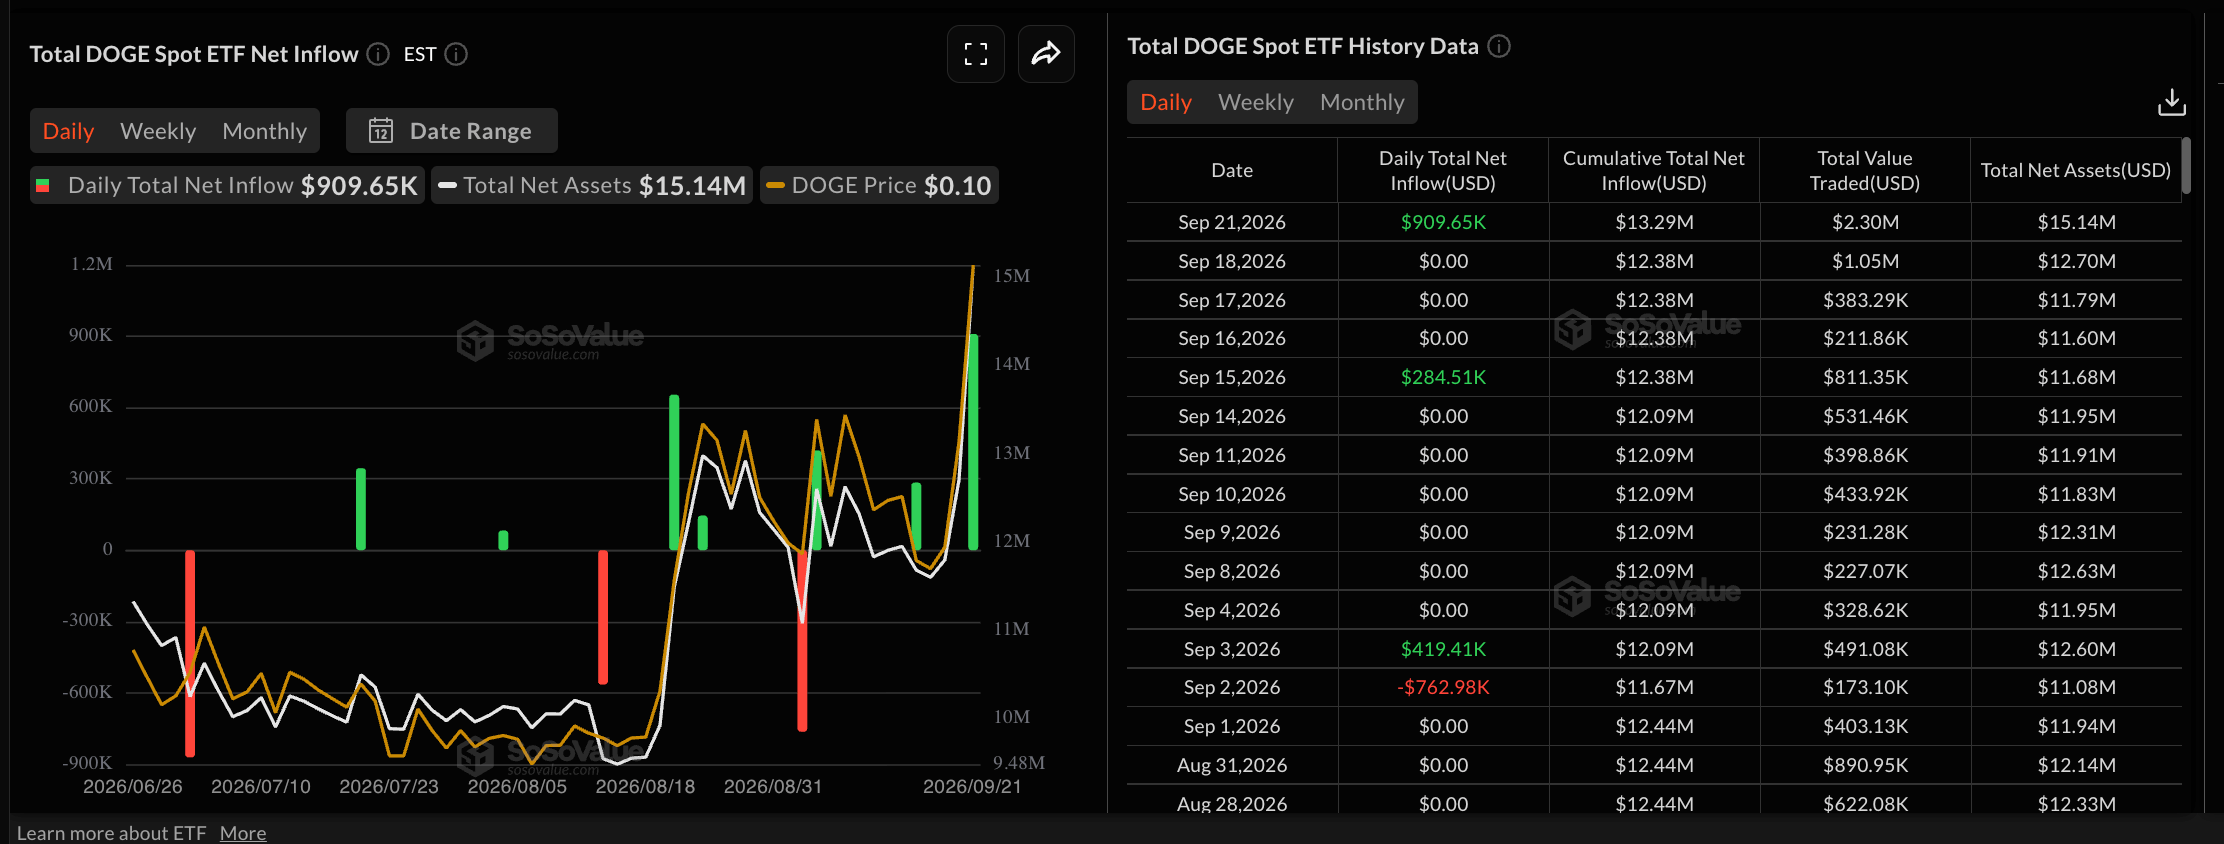
- DOGE-focused ETFs recorded over $900,000 in inflows on Monday, indicating renewed institutional confidence.
- The technical outlook for DOGE indicates an upside bias as bulls focus on breaking above the supply barrier at $0.10.
Dogecoin (DOGE) price steadies around $0.10 on Tuesday, sustaining its 14% gains from the previous day. The meme coin recovers on renewed institutional demand, with inflows of over $900,000 on Monday. Dogecoin must confirm a bullish breakout above a supply zone near $0.10219 to extend its rally.
Institutional risk appetite extends to DOGE
Dogecoin-focused Exchange Traded Funds (ETFs) show early signs of renewed interest in the OG meme coin as the broader cryptocurrency market prepares for the next potential bull cycle. DOGE ETFs recorded $909,650 in inflows on Monday, up from $284,510 on September 15. Positive ETF inflows serve as large demand spikes and typically drive up retail interest, which could support meme coins’ recovery.
Technical outlook: DOGE rally could struggle near $0.10
Dogecoin hovers above $0.10000 at press time on Monday, extending its 14% recovery from the previous day. The meme coin rally surpassed a dominant downward resistance trendline at $0.09110, which now acts as underlying support.
Dogecoin also hovers above the 50-day and 100-day Exponential Moving Averages (EMAs), clustered around $0.08365 and $0.08350, respectively, along with the 200-day EMA at $0.09256, reinforcing a constructive near-term bias.
Momentum on the daily chart remains strong, with the Moving Average Convergence Divergence (MACD) crossing above its signal line and the histogram expanding positively, suggesting bullish momentum is building. At the same time, the Relative Strength Index (RSI) at 72 is in overbought territory, suggesting early signs of a stretch.
Looking up, DOGE must confirm the bullish breakout of the supply zone between $0.10000 and $0.10219, which could open the path toward the resistance range between $0.11619 and $0.11732.
On the downside, initial support is seen at the recent breakout zone around the 200-day EMA at $0.09256, closely followed by the reclaimed descending trendline break level at $0.09110. Deeper pullbacks would likely look toward the EMA cluster formed by the 50-day and 100-day EMAs at $0.08365 and $0.08350, respectively, where buyers could attempt to reassert control if profit-taking intensifies.
(The technical analysis of this story was written with the help of an AI tool. Know more.)
Nothing in this material constitutes investment advice, personal recommendation, investment research, an offer, or a solicitation to buy or sell any financial instrument. The content has been prepared without consideration of your individual investment objectives, financial situation, or needs, and should not be treated as such.
Past performance is not a reliable indicator of future performance and/or results. Forward-looking scenarios or forecasts are not a guarantee of future performance. Actual results may differ materially from those anticipated.
Mitrade makes no representation or warranty as to the accuracy or completeness of the information provided and accepts no liability for any loss arising from reliance on such information.
Recommended Articles


