

Dow Jones Industrial Average surges 550 points on Tuesday as rate cut bets solidify
- The Dow Jones gained 550 points on Tuesday despite clear market headwinds.
- Market bets of a Fed interest rate cut in December continue to crystallize.
- Despite a market party on interest rate expectations, key problem areas continue to bloat.
The Dow Jones Industrial Average (DJIA) gained a volatile 550-plus points on Tuesday, rallying out of an early volatility spat as investors rolled with the punches on conflicting headlines. Markets eventually settled into a bullish tilt during a holiday-shortened trading week, but key tech stocks are continuing to drag down the rally-leading AI segment.
AI tech rally darling Nvidia (NVDA) is down 4% on Tuesday, taking a fresh hit and extending its decline from record highs above $205 per share to 14%. According to market reporting, late entrant to the AI party and Facebook parent company Meta Platforms (META) is exploring its options to invest in acquiring Google parent Alphabet’s (GOOG) AI-focused chipsets.
When not overly concerned about pie-eyed AI-led revenue expectations, markets remain hinged singularly around the chances that the Federal Reserve (Fed) will resume delivering interest rate cuts. Rate markets are now pricing in over 82% odds of a quarter-point interest rate cut on December 10 after several key Fed officials hinted that they may be more open to immediate moves on interest rates than previously expected.
The good the bad, and the irrelevant
US Producer Price Index (PPI) inflation metrics eased down in September, with core PPI slipping to 2.6% YoY compared to the previous period’s slightly revised 2.9%. US Retail Sales figures rose in September by 0.2%. The figure shows US retail activity expanding, albeit slightly less than expected.
However, headline Retail Sales by itself paints a different picture than Retail Sales from a wider view. Mainline Retail Sales figures are not adjusted for inflation; after taking Consumer Price Index (CPI) inflation adjustments into consideration, September’s real Retail Sales figure shows a slight contraction as consumers grapple with an increasingly uncomfortable economic landscape.
According to the Conference Board’s (CB) latest Consumer Confidence Index, aggregated consumer expectations and overall economic outlook deteriorated in November, falling 6.8 points to 88.7, the indicator’s lowest reading since April. Markets broadly anticipated an upswing to 93.2.
Dow Jones price forecast
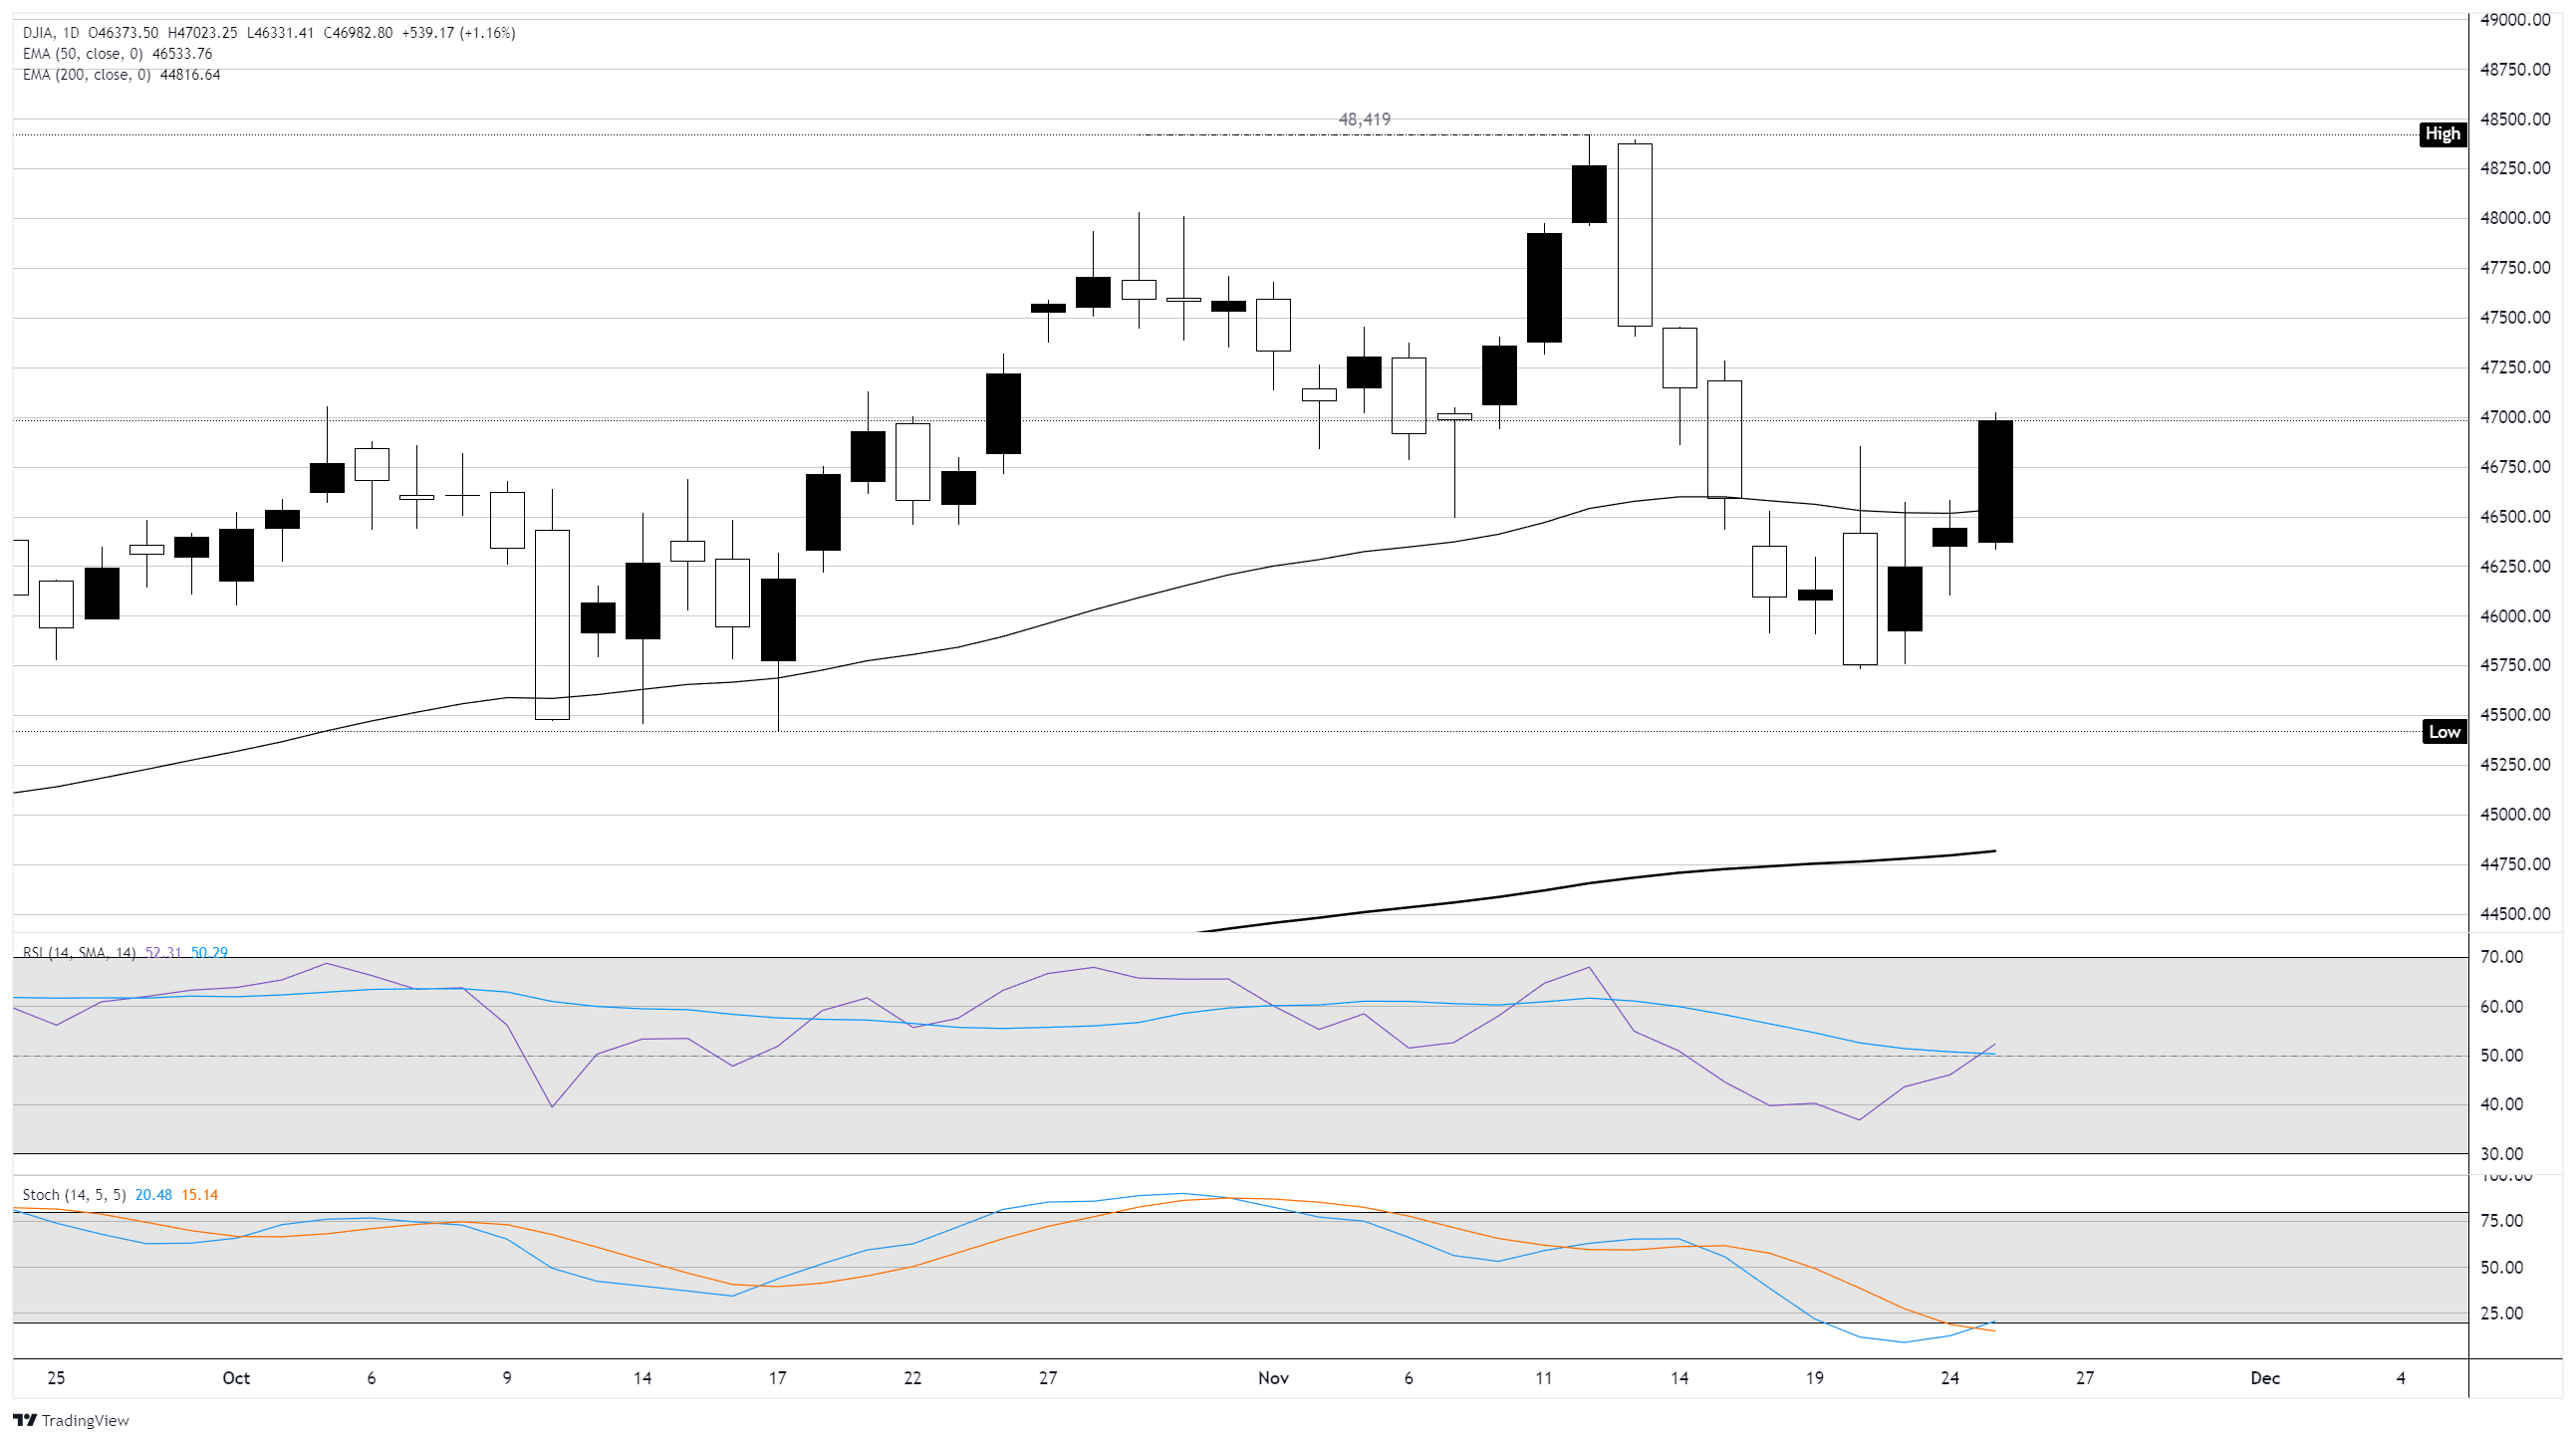
In the daily chart, DJIA trades at 47,007.20. Price holds above the 50-day EMA at 46,546.28 and well above the 200-day EMA at 44,605.18, maintaining a bullish tone. The 50-day EMA has stabilized after a mild pullback, while the 200-day EMA continues to rise. RSI at 52.56 is neutral, edging higher and signaling a modest improvement in momentum.
Stochastic at 20.67 has turned up from deeply oversold, hinting at a nascent recovery in the short-term. The descending trend line from 48,419.01 limits advances, with resistance seen near 47,925.93. A close above that barrier would open the path toward 48,419.01, while failure to break could keep price contained and invite dips toward the 50-day EMA.
Dow Jones daily chart
Dow Jones FAQs
The Dow Jones Industrial Average, one of the oldest stock market indices in the world, is compiled of the 30 most traded stocks in the US. The index is price-weighted rather than weighted by capitalization. It is calculated by summing the prices of the constituent stocks and dividing them by a factor, currently 0.152. The index was founded by Charles Dow, who also founded the Wall Street Journal. In later years it has been criticized for not being broadly representative enough because it only tracks 30 conglomerates, unlike broader indices such as the S&P 500.
Many different factors drive the Dow Jones Industrial Average (DJIA). The aggregate performance of the component companies revealed in quarterly company earnings reports is the main one. US and global macroeconomic data also contributes as it impacts on investor sentiment. The level of interest rates, set by the Federal Reserve (Fed), also influences the DJIA as it affects the cost of credit, on which many corporations are heavily reliant. Therefore, inflation can be a major driver as well as other metrics which impact the Fed decisions.
Dow Theory is a method for identifying the primary trend of the stock market developed by Charles Dow. A key step is to compare the direction of the Dow Jones Industrial Average (DJIA) and the Dow Jones Transportation Average (DJTA) and only follow trends where both are moving in the same direction. Volume is a confirmatory criteria. The theory uses elements of peak and trough analysis. Dow’s theory posits three trend phases: accumulation, when smart money starts buying or selling; public participation, when the wider public joins in; and distribution, when the smart money exits.
There are a number of ways to trade the DJIA. One is to use ETFs which allow investors to trade the DJIA as a single security, rather than having to buy shares in all 30 constituent companies. A leading example is the SPDR Dow Jones Industrial Average ETF (DIA). DJIA futures contracts enable traders to speculate on the future value of the index and Options provide the right, but not the obligation, to buy or sell the index at a predetermined price in the future. Mutual funds enable investors to buy a share of a diversified portfolio of DJIA stocks thus providing exposure to the overall index.
Nothing in this material constitutes investment advice, personal recommendation, investment research, an offer, or a solicitation to buy or sell any financial instrument. The content has been prepared without consideration of your individual investment objectives, financial situation, or needs, and should not be treated as such.
Past performance is not a reliable indicator of future performance and/or results. Forward-looking scenarios or forecasts are not a guarantee of future performance. Actual results may differ materially from those anticipated.
Mitrade makes no representation or warranty as to the accuracy or completeness of the information provided and accepts no liability for any loss arising from reliance on such information.
Recommended Articles


