

Dow Jones Industrial Average sees hesitating gains as Fed rate call looms
- US equity indices edged higher on Tuesday as markets extended Monday's rebound, with the Dow Jones Industrial Average climbing modestly.
- The Federal Reserve is widely expected to hold interest rates unchanged at its March 18 decision, though the updated dot plot and economic projections take centre stage given surging energy prices.
- Rate cut expectations have been sharply repriced — markets now price just one cut in December, pulling back from earlier forecasts.
US stocks posted a second consecutive session of gains on Tuesday, with the Dow Jones Industrial Average (DJIA) adding around 0.3% to hold in the 47,000 region. The S&P 500 rose approximately 0.3%, and the Nasdaq Composite gained a similar amount. Sentiment remained cautious ahead of Wednesday's Federal Open Market Committee (FOMC) decision, with volatile Crude Oil prices and the ongoing US-Israel war on Iran continuing to set the macro tone.
Fed on deck: dot plot in the spotlight
The Federal Reserve (Fed) kicked off its two-day meeting on Tuesday, with the its latest policy statement due at 18:00 GMT on Wednesday. CME FedWatch data shows a 94% probability the Fed holds rates at 3.50%–3.75%, making the decision itself a near-foregone conclusion. What markets are laser-focused on is the updated Summary of Economic Projections (SEP) and the dot plot of policymaker rate expectations: the first SEP update since the Iran conflict erupted and Crude Oil surged above $100 per barrel. Rate cut expectations have been aggressively unwound over the past week.
Prior to the conflict, futures markets had a June cut firmly priced with a reasonable shot at a second move in September. That's all gone now. The CME FedWatch tool currently shows just one cut priced for December 2026, with no reductions seen at any earlier meeting. Goldman Sachs formally pushed its forecast for the next cut out to September, while acknowledging even that depends on labour market deterioration. Chair Jerome Powell's press conference language on energy-driven inflation and the growth outlook will be critical, as any dovish tilt would likely be taken as a green light for equities.
Oil, Iran, and energy stocks
Brent crude pushed back above $100 per barrel on Tuesday, up around 2% on the session, as markets continued to discount a smooth or swift resolution to the disruptions in the Strait of Hormuz. US and Israeli strikes on Iran and Gulf Cooperation Council targets have kept supply concerns elevated, and a US-backed tanker escort plan has so far met a lukewarm response from allies. Energy was the leading S&P 500 sector on the day, gaining close to 2%, with Exxon Mobil (XOM) and Occidental Petroleum (OXY) each adding over 1%. Gold (Gold) held steady above $5,000 per troy ounce, reflecting persistent safe-haven demand.
Airlines rebound on upgraded guidance
Delta Air Lines (DAL) was one of the session's standout movers, rallying more than 4% after raising its first-quarter revenue growth guidance to high single-digit expansion, up from a prior forecast of 5%–7%. American Airlines (AAL) and JetBlue (JBLU) also gained on the back of the optimistic read-across for travel demand. The moves suggest consumers are still booking travel despite elevated fuel costs and broader macro uncertainty — a notable data point for the Fed as it gauges whether demand-side pressures remain sticky.
Dow leaders: Goldman, IBM, and American Express
Among the DJIA's 30 components, Goldman Sachs (GS), IBM (IBM), and American Express (AXP) were the top performers, each gaining more than 2%. Financials and industrials benefited from the broader risk-on tone, even as six of the S&P 500's eleven sectors remained in negative territory. On the downside, Johnson & Johnson (JNJ) and Amgen (AMGN) were the index's weakest links.
AI trade and asset managers
Nvidia (NVDA) edged higher after its annual GTC developers conference, where the company projected it will generate $1 trillion in revenues from AI chip sales by 2027. Asset managers including KKR (KKR), Blackstone (BX), and BlackRock (BLK) surged between 3% and 5%, as traders reassessed default risk concerns on private credit positions in the software sector. Bank of America (BAC) reiterated a Buy rating on German software stock SAP (SAP), citing its defensive business profile and resilience to AI disruption fears, with analysts projecting double-digit earnings growth in its upcoming quarterly results.
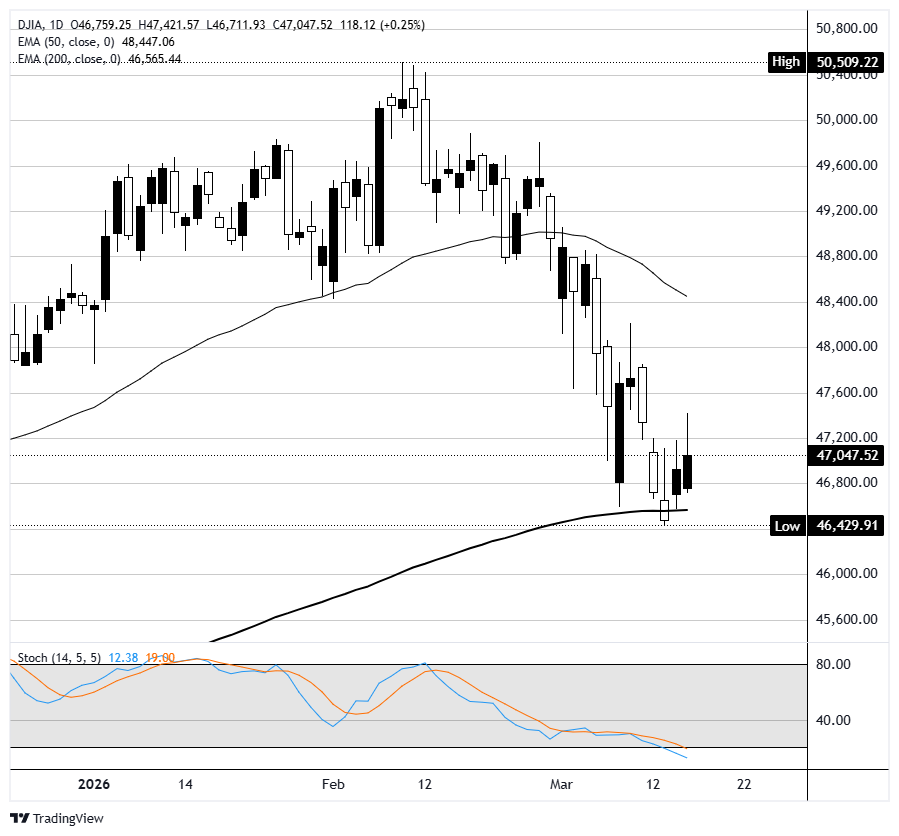
Dow Jones daily chart
Dow Jones FAQs
The Dow Jones Industrial Average, one of the oldest stock market indices in the world, is compiled of the 30 most traded stocks in the US. The index is price-weighted rather than weighted by capitalization. It is calculated by summing the prices of the constituent stocks and dividing them by a factor, currently 0.152. The index was founded by Charles Dow, who also founded the Wall Street Journal. In later years it has been criticized for not being broadly representative enough because it only tracks 30 conglomerates, unlike broader indices such as the S&P 500.
Many different factors drive the Dow Jones Industrial Average (DJIA). The aggregate performance of the component companies revealed in quarterly company earnings reports is the main one. US and global macroeconomic data also contributes as it impacts on investor sentiment. The level of interest rates, set by the Federal Reserve (Fed), also influences the DJIA as it affects the cost of credit, on which many corporations are heavily reliant. Therefore, inflation can be a major driver as well as other metrics which impact the Fed decisions.
Dow Theory is a method for identifying the primary trend of the stock market developed by Charles Dow. A key step is to compare the direction of the Dow Jones Industrial Average (DJIA) and the Dow Jones Transportation Average (DJTA) and only follow trends where both are moving in the same direction. Volume is a confirmatory criteria. The theory uses elements of peak and trough analysis. Dow’s theory posits three trend phases: accumulation, when smart money starts buying or selling; public participation, when the wider public joins in; and distribution, when the smart money exits.
There are a number of ways to trade the DJIA. One is to use ETFs which allow investors to trade the DJIA as a single security, rather than having to buy shares in all 30 constituent companies. A leading example is the SPDR Dow Jones Industrial Average ETF (DIA). DJIA futures contracts enable traders to speculate on the future value of the index and Options provide the right, but not the obligation, to buy or sell the index at a predetermined price in the future. Mutual funds enable investors to buy a share of a diversified portfolio of DJIA stocks thus providing exposure to the overall index.
Nothing in this material constitutes investment advice, personal recommendation, investment research, an offer, or a solicitation to buy or sell any financial instrument. The content has been prepared without consideration of your individual investment objectives, financial situation, or needs, and should not be treated as such.
Past performance is not a reliable indicator of future performance and/or results. Forward-looking scenarios or forecasts are not a guarantee of future performance. Actual results may differ materially from those anticipated.
Mitrade makes no representation or warranty as to the accuracy or completeness of the information provided and accepts no liability for any loss arising from reliance on such information.
Recommended Articles


