



Dow Jones Industrial Average surges as Iran reopens Strait of Hormuz
- DJIA rocketed higher by more than 1K points, or 2.3%, after Iran declared the Strait of Hormuz "completely open" for commercial shipping.
- S&P 500 broke above 7,100 for the first time while Nasdaq Composite and Russell 2000 also printed fresh all-time highs.
- Oil prices collapsed, with West Texas Intermediate crude plunging 14% and Brent dropping 10% as supply disruption fears eased.
- Trump's celebratory tone on the reopening sits awkwardly alongside a US naval blockade of Iranian ports that Tehran says could trigger the strait's reclosure.
US equities ripped higher on Friday as a ceasefire between Israel and Lebanon, paired with Iran's announcement that the Strait of Hormuz would reopen to commercial traffic, triggered a broad risk-on rally. DJIA added more than 1K points to finish just below 49,800, the S&P 500 gained 1.5% to push past 7,100 for the first time in history, and the Nasdaq Composite climbed 1.7%. The small-cap Russell 2000 led the pack with a 2.2% advance, underscoring the breadth of the move.
Iran opens Hormuz as Lebanon ceasefire takes hold
Iranian Foreign Minister Seyed Abbas Araghchi announced on X that, in line with the Lebanon ceasefire, passage for all commercial vessels through the Strait of Hormuz would be completely open for the duration of the truce. President Donald Trump had said Thursday that Israel and Lebanon agreed to a 10-day ceasefire, which took effect at 21:00 GMT the same day. Trump followed up by thanking Iran on Truth Social and claimed Tehran had agreed to never close the waterway again, a framing that read as cleaner than the conditional language in Iran's actual statement.
The catch in Washington's messaging
In a separate post, Trump said the US Navy's blockade of Iranian ports will remain in full force until a peace agreement with Tehran is reached, adding that the process should move quickly because most of the points are already negotiated. Iran's Tasnim news agency, however, reported that vessels tied to hostile nations will not be permitted through the strait, and that the waterway will close again if the US blockade persists. Two mutually dependent conditions running in opposite directions is a tension the market chose to look past on Friday, though it's one that keeps the trade headline-sensitive into next week.
Oil collapses on supply relief
WTI futures dropped 14% to trade above $80 a barrel, while international benchmark Brent fell 10% to above $89. The unwind reflected a rapid draining of the Hormuz risk premium baked into prices during the preceding weeks of escalation. Whether the decline extends further will hinge on whether Tehran's conditions hold and whether Washington eases the naval posture, which remains the mechanical lever Iran has flagged as grounds for reversing course.
Travel, cruise, and aerospace rebound
Stocks with the most direct exposure to a Hormuz disruption led the charge. Boeing (BA) climbed 3% and Royal Caribbean (RCL) surged 10%, while Amazon (AMZN) and Airbnb (ABNB) also pushed higher. Cruise operators have been among the hardest hit by the Middle East escalation, and the size of Friday's bounce reflected traders unwinding insurance positioning that had been building up over recent sessions rather than fresh money chasing the headline.
Dow Jones futures snap sharply higher
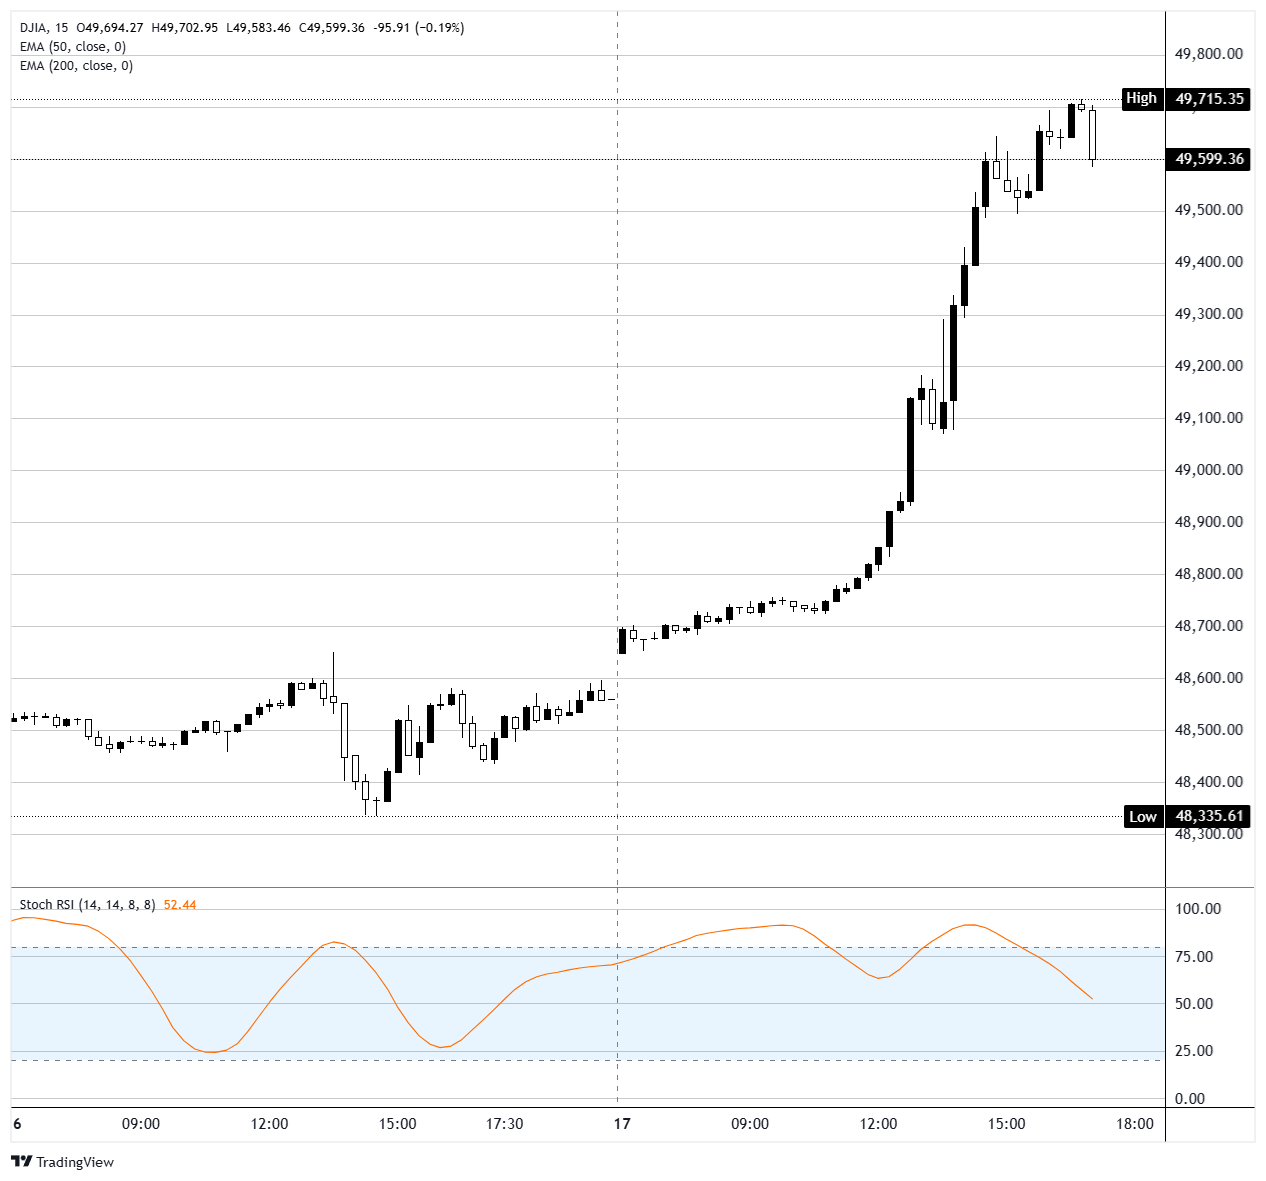
Dow Jones futures (YM) gapped up on the Araghchi headline during the overnight session and held the gains cleanly through the US cash open, running in lockstep with the index into the close. The 15-minute chart showed a steady grind higher from the 48,700 area in the first hours of trade before accelerating through 49,000 around midday and stretching toward 49,700 by late afternoon GMT. Intraday volume was heavy, consistent with short-covering layered on top of existing long positioning, and Stochastic Relative Strength Index readings on the intraday chart had pulled back from overbought territory by the close, suggesting some modest digestion of the move rather than exhaustion.
Rally context and what's next
The three major averages are pacing solid weekly gains, with DJIA up 3%, S&P 500 up 4%, and Nasdaq up 6%. Ameriprise Financial chief market strategist Anthony Saglimbene argued the market has walked back worst-case scenarios and is now pricing a path toward de-escalation, but cautioned that the easy part of the rally is probably behind. He added that tech, and the Magnificent Seven in particular, will need to deliver both earnings beats and strong forward outlooks to justify further upside from here. With the geopolitical overhang fading, the focus pivots back to earnings and the next round of inflation data, with traders watching the upcoming Producer Price Index (PPI) print as the key near-term macro catalyst.
Dow Jones 15-minute chart
Dow Jones FAQs
The Dow Jones Industrial Average, one of the oldest stock market indices in the world, is compiled of the 30 most traded stocks in the US. The index is price-weighted rather than weighted by capitalization. It is calculated by summing the prices of the constituent stocks and dividing them by a factor, currently 0.152. The index was founded by Charles Dow, who also founded the Wall Street Journal. In later years it has been criticized for not being broadly representative enough because it only tracks 30 conglomerates, unlike broader indices such as the S&P 500.
Many different factors drive the Dow Jones Industrial Average (DJIA). The aggregate performance of the component companies revealed in quarterly company earnings reports is the main one. US and global macroeconomic data also contributes as it impacts on investor sentiment. The level of interest rates, set by the Federal Reserve (Fed), also influences the DJIA as it affects the cost of credit, on which many corporations are heavily reliant. Therefore, inflation can be a major driver as well as other metrics which impact the Fed decisions.
Dow Theory is a method for identifying the primary trend of the stock market developed by Charles Dow. A key step is to compare the direction of the Dow Jones Industrial Average (DJIA) and the Dow Jones Transportation Average (DJTA) and only follow trends where both are moving in the same direction. Volume is a confirmatory criteria. The theory uses elements of peak and trough analysis. Dow’s theory posits three trend phases: accumulation, when smart money starts buying or selling; public participation, when the wider public joins in; and distribution, when the smart money exits.
There are a number of ways to trade the DJIA. One is to use ETFs which allow investors to trade the DJIA as a single security, rather than having to buy shares in all 30 constituent companies. A leading example is the SPDR Dow Jones Industrial Average ETF (DIA). DJIA futures contracts enable traders to speculate on the future value of the index and Options provide the right, but not the obligation, to buy or sell the index at a predetermined price in the future. Mutual funds enable investors to buy a share of a diversified portfolio of DJIA stocks thus providing exposure to the overall index.
Nothing in this material constitutes investment advice, personal recommendation, investment research, an offer, or a solicitation to buy or sell any financial instrument. The content has been prepared without consideration of your individual investment objectives, financial situation, or needs, and should not be treated as such.
Past performance is not a reliable indicator of future performance and/or results. Forward-looking scenarios or forecasts are not a guarantee of future performance. Actual results may differ materially from those anticipated.
Mitrade makes no representation or warranty as to the accuracy or completeness of the information provided and accepts no liability for any loss arising from reliance on such information.
Recommended Articles


