



Dow Jones Industrial Average hits record as investors rotate out of chips
- The Dow jumped 865 points, or 1.7%, to a fresh record high as money rotated out of chip names and into non-tech stocks.
- A Broadcom revenue miss sparked a broad semiconductor selloff, pulling the Nasdaq Composite lower while the S&P 500 scraped out a small gain.
- UnitedHealth, JPMorgan Chase and Walmart led the Dow higher, while the chip complex tracked Broadcom lower.
- Jobless claims ticked up and Strait of Hormuz tensions lingered ahead of Friday's Nonfarm Payrolls report.
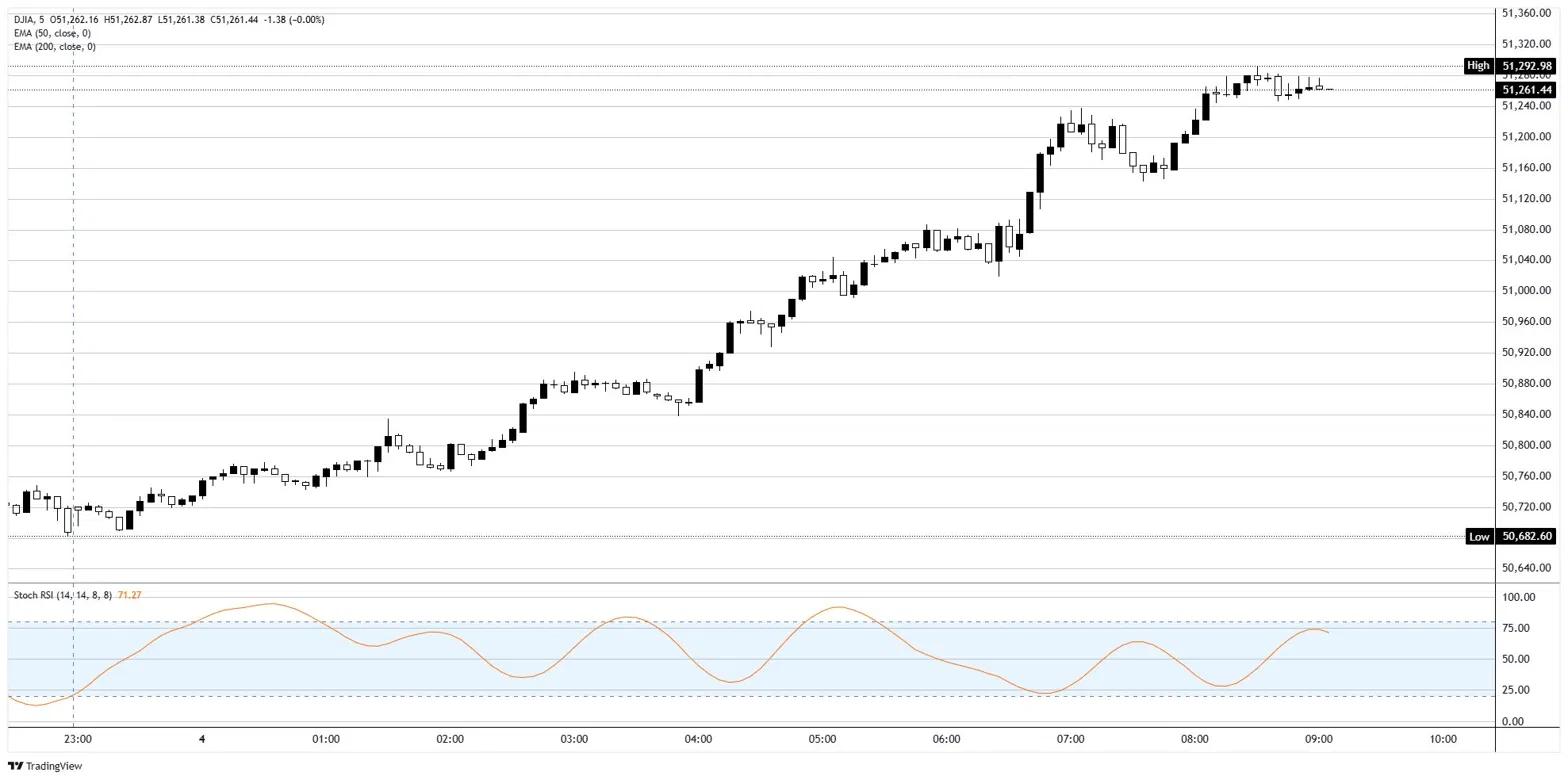
The Dow Jones Industrial Average (DJIA) tore to a record on Thursday, adding 865 points, or 1.7%, to settle above 51,000 and print an intraday high near 51,300. The split tape underneath told the real story. The S&P 500 managed just a 0.2% gain and the Nasdaq Composite slipped 0.2%, as investors pulled cash out of crowded artificial intelligence trades and parked it in the old-economy names that dominate the price-weighted Dow. On the daily chart the index sits well above its 50-day and 200-day moving averages, a trend that has been intact since the early-April lows near 45,000.
The chip trade finally blinks
The rotation was set off by Broadcom (AVGO), which slid roughly 15% after its fiscal second-quarter revenue came in light and forward guidance failed to deliver the blowout AI growth the Street had priced in. The reaction punished the whole complex. The VanEck Semiconductor ETF (SMH) shed more than 2%, Micron Technology (MU) dropped 7.7%, and Arm Holdings (ARM) fell 6%. CrowdStrike (CRWD) added to the gloom outside the chip space, sinking around 10% on soft guidance of its own. The semis had led the market's latest charge to records, so a stumble there was always going to sting the Nasdaq hardest. The takeaway is less that the AI story is over and more that not every AI-linked name carries the same expectations, and the bar after this earnings season is high.
Defensives and banks do the heavy lifting
With chips offside, the Dow's gains came from elsewhere. UnitedHealth (UNH) led the charge, climbing 5.8%, while JPMorgan Chase (JPM) rose 2.7% and Walmart (WMT) added 1.4%. The bid spread beyond the index too, with Costco (COST) up 2% and Eli Lilly (LLY) gaining 4.5%. It was a textbook defensive-and-financials rotation, the kind that flatters the Dow precisely when the high-multiple growth names that drive the Nasdaq are getting sold.
Labor data sends a mixed signal
The macro calendar offered something for both camps. Initial Jobless Claims rose to 225K, above the 213K consensus and the prior 212K, a soft patch that markets read as one more nudge toward eventual Fed easing. Challenger job cuts for May jumped to 97K from a far smaller prior reading, hinting at cracks in hiring. At the same time, first-quarter Nonfarm Productivity came in at 0.3% against a 0.8% expectation, with Unit Labor Costs at 1.8%. None of it was decisive, but the drift points to a labor market that is cooling rather than collapsing.
Hormuz risk that nobody wants to price
Sitting underneath the equity euphoria is a Middle East standoff the tape keeps shrugging off. Attacks have escalated between the US and Iran, with Iran striking Kuwait International Airport early Wednesday after US Central Command said it had defeated multiple Iranian missiles and drones and carried out self-defense strikes on Qeshm Island in the Persian Gulf. The Strait of Hormuz stalemate shows no sign of resolving, and Oil sits as the obvious transmission channel. Records and complacency tend to travel together, and a market this stretched after a two-month surge has little cushion if the geopolitical premium suddenly reprices.
Fed voices and the jobs report ahead
Two Fed speakers crossed the wires Thursday, with Daly leaning hawkish at 15:30 GMT and Schmid following at 16:00 GMT, keeping the rate debate live without moving it much. The real test lands Friday at 12:30 GMT, when the May Nonfarm Payrolls (NFP) report is due. Consensus looks for around 85K new jobs against 115K previously, with the Unemployment Rate seen holding at 4.3% and Average Hourly Earnings watched closely for any wage stickiness. A soft print would feed the easing narrative that has helped power the Dow to records; a hot one, paired with simmering Oil risk, could give this stretched rally the excuse to catch its breath.
Dow Jones 5-minute chart
Dow Jones FAQs
The Dow Jones Industrial Average, one of the oldest stock market indices in the world, is compiled of the 30 most traded stocks in the US. The index is price-weighted rather than weighted by capitalization. It is calculated by summing the prices of the constituent stocks and dividing them by a factor, currently 0.152. The index was founded by Charles Dow, who also founded the Wall Street Journal. In later years it has been criticized for not being broadly representative enough because it only tracks 30 conglomerates, unlike broader indices such as the S&P 500.
Many different factors drive the Dow Jones Industrial Average (DJIA). The aggregate performance of the component companies revealed in quarterly company earnings reports is the main one. US and global macroeconomic data also contributes as it impacts on investor sentiment. The level of interest rates, set by the Federal Reserve (Fed), also influences the DJIA as it affects the cost of credit, on which many corporations are heavily reliant. Therefore, inflation can be a major driver as well as other metrics which impact the Fed decisions.
Dow Theory is a method for identifying the primary trend of the stock market developed by Charles Dow. A key step is to compare the direction of the Dow Jones Industrial Average (DJIA) and the Dow Jones Transportation Average (DJTA) and only follow trends where both are moving in the same direction. Volume is a confirmatory criteria. The theory uses elements of peak and trough analysis. Dow’s theory posits three trend phases: accumulation, when smart money starts buying or selling; public participation, when the wider public joins in; and distribution, when the smart money exits.
There are a number of ways to trade the DJIA. One is to use ETFs which allow investors to trade the DJIA as a single security, rather than having to buy shares in all 30 constituent companies. A leading example is the SPDR Dow Jones Industrial Average ETF (DIA). DJIA futures contracts enable traders to speculate on the future value of the index and Options provide the right, but not the obligation, to buy or sell the index at a predetermined price in the future. Mutual funds enable investors to buy a share of a diversified portfolio of DJIA stocks thus providing exposure to the overall index.
Nothing in this material constitutes investment advice, personal recommendation, investment research, an offer, or a solicitation to buy or sell any financial instrument. The content has been prepared without consideration of your individual investment objectives, financial situation, or needs, and should not be treated as such.
Past performance is not a reliable indicator of future performance and/or results. Forward-looking scenarios or forecasts are not a guarantee of future performance. Actual results may differ materially from those anticipated.
Mitrade makes no representation or warranty as to the accuracy or completeness of the information provided and accepts no liability for any loss arising from reliance on such information.
Recommended Articles


