



Ripple and Stellar outlook: XRP and XLM face deeper correction risks
- XRP extends losses on Tuesday after falling nearly 2% on the previous day.
- XLM gravitates toward the key support at $0.177, a close below this level suggests a deeper correction.
- Geopolitical uncertainty and a weakening technical outlook support a bearish outlook for XRP and XLM.
Ripple (XRP) and Stellar (XLM) remain under pressure, extending their correction on Tuesday amid broader risk-off conditions following US-Iran tensions. XRP slips below $1.070, while XLM hovers near the critical support at $0.177; both altcoins suggest deeper correction amid geopolitical risks and a deteriorating technical outlook.
Risk-off sentiment weighs on XRP and XLM
The United States Central Command (CENTCOM) said on Tuesday that US forces completed new strikes on Iranian military targets, adding that more than 50,000 US service members are currently deployed across the Middle East, Reuters reported.
The source said that it struck military targets across Iran, including Bushehr, Chabahar, Jask, Konarak, Abu Musa, and Bandar Abbas.
Meanwhile, Iran's Nournews confirmed that areas of southern Iran's Bushehr were hit in a renewed US attack.
In addition, the Iranian Islamic Revolutionary Guards Corps (IRGC) said on the same day that two "offending supertankers" were hit and disabled in the Strait of Hormuz. IRGC said that the tankers ignored warnings, turned off their navigation systems, and tried to pass through a 'mined route.’
The Iranian military said that cooperation with the 'aggressor enemy' in the critical waterway will delay reopening of the waterway and create a global energy crisis.
Global markets continued the week on a risk-off footing as renewed tensions between the US and Iran dampened investor sentiment. Rising geopolitical uncertainty pushed West Texas Intermediate (WTI) crude oil prices above $80 per barrel, while risk assets such as XRP and XLM came under pressure, slipping below $1.070 and $0.180, respectively, on Tuesday.
Derivatives data shows a bearish bias
Derivatives metrics show a bearish bias for Ripple and Stellar. XRP’s futures Open Interest (OI) dips to $2.35 billion on Tuesday, having fallen steadily since a mild rise in early July and now remaining in a broader downward trend.
During the same period, XLM’s OI drops to $180.95 million, having fallen steadily since a sharp rise in June. These declines in OI alongside falling prices suggest a bearish outlook.
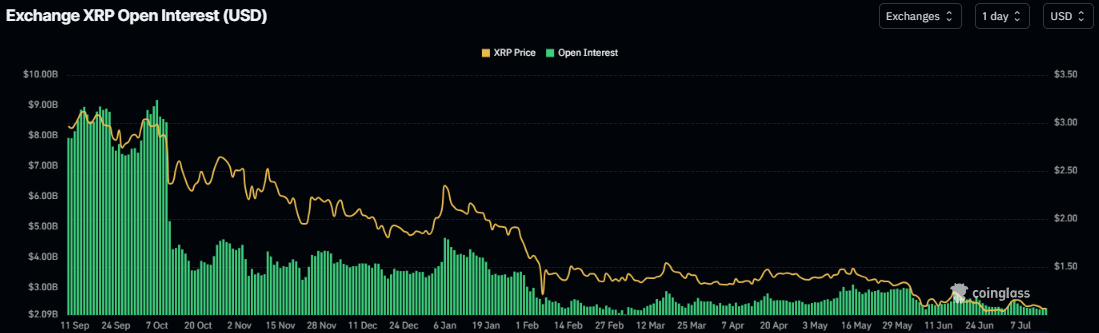
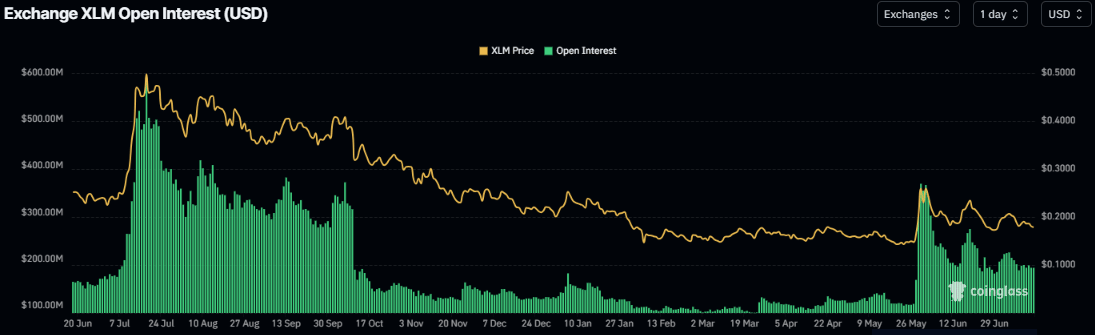
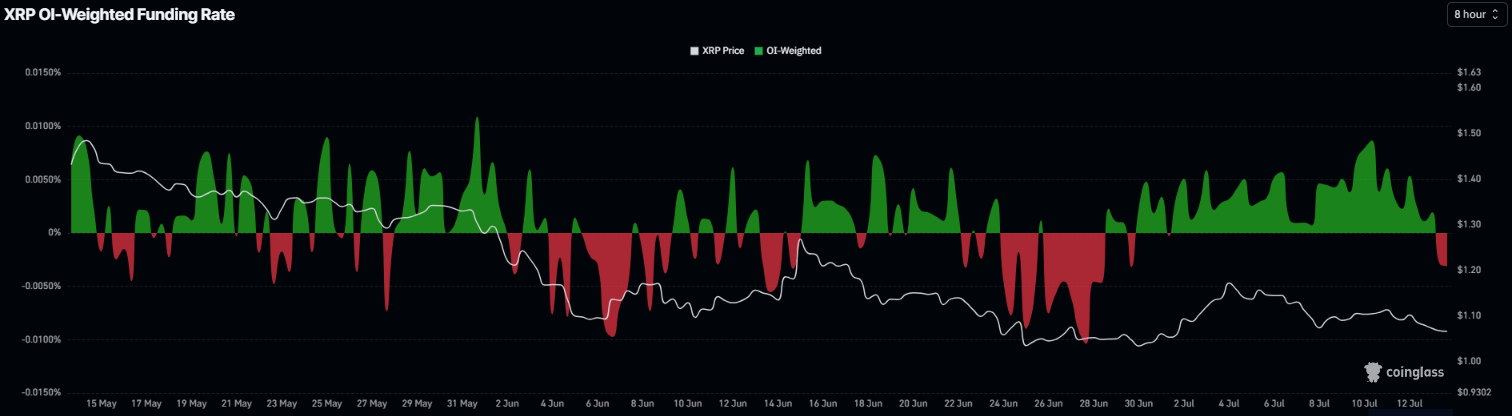
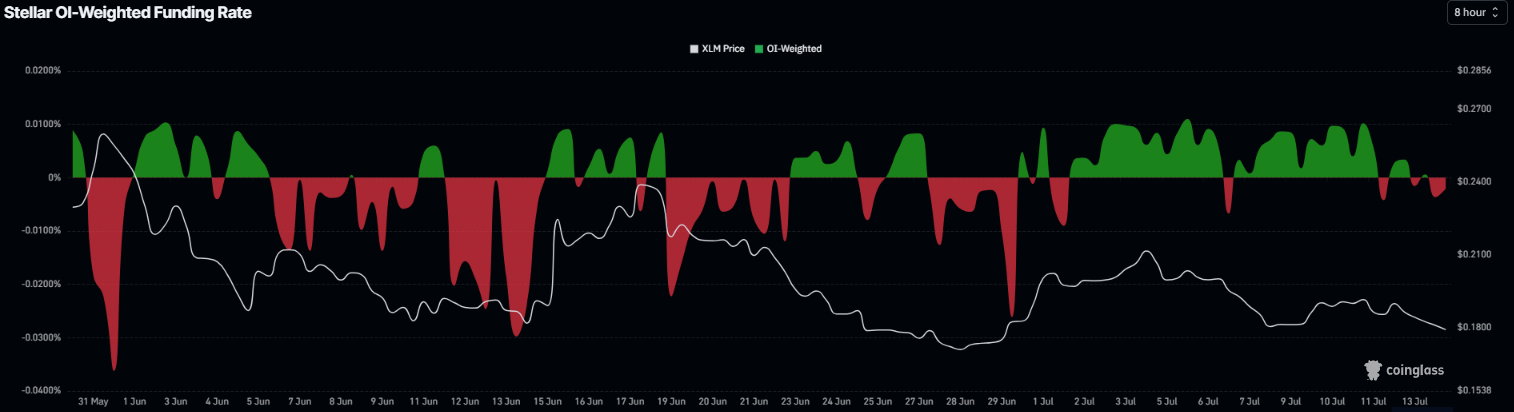
In addition, XRP and XLM funding rates flipped negative on Monday, reading -0.0031% and -0.0021%, respectively, and remained negative on Tuesday, indicating bearish sentiment.
XRP technical outlook: Bears aiming for the $1 psychological support
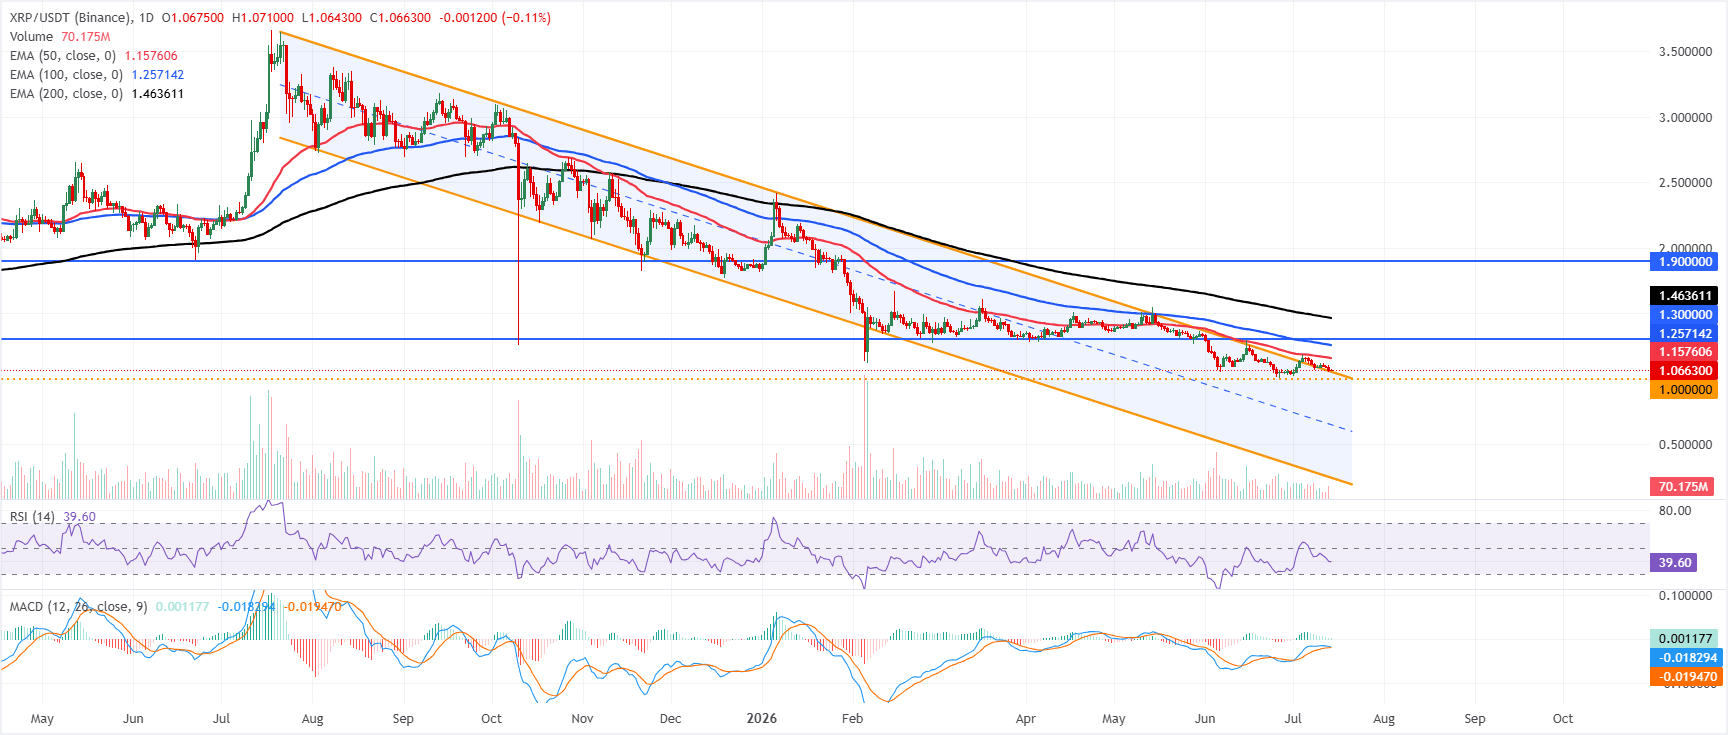
XRP trades at $1.065 on Tuesday, extending its decline below all key Exponential Moving Averages (EMAs) and retaining a bearish near-term bias. The 50-day EMA at $1.157, together with the 100-day EMA at $1.257 and the more distant 200-day EMA at $1.463, sit overhead as successive trend resistances that cap the upside.
Momentum is mixed but tilted lower, as the Relative Strength Index (RSI) at 39 remains in bearish territory, while the Moving Average Convergence Divergence (MACD) indicator hovers just above zero with a marginally positive line, suggesting only tentative stabilization rather than a clear recovery.
On the topside, initial resistance is seen at the 50-day EMA near $1.157, followed by the 100-day EMA at $1.257 and the horizontal barrier at $1.300; beyond that, the 200-day EMA at $1.463 and the major resistance zone around the $1.900 mark are deeper recovery targets.
On the downside, immediate support emerges around the current trading area, with the parallel channel level clustered near $1.050. At the same time, a break lower would expose the psychological and structural floor at $1.000, where buyers are likely to attempt to reassert demand.
XLM technical outlook: Momentum indicators turn bearish
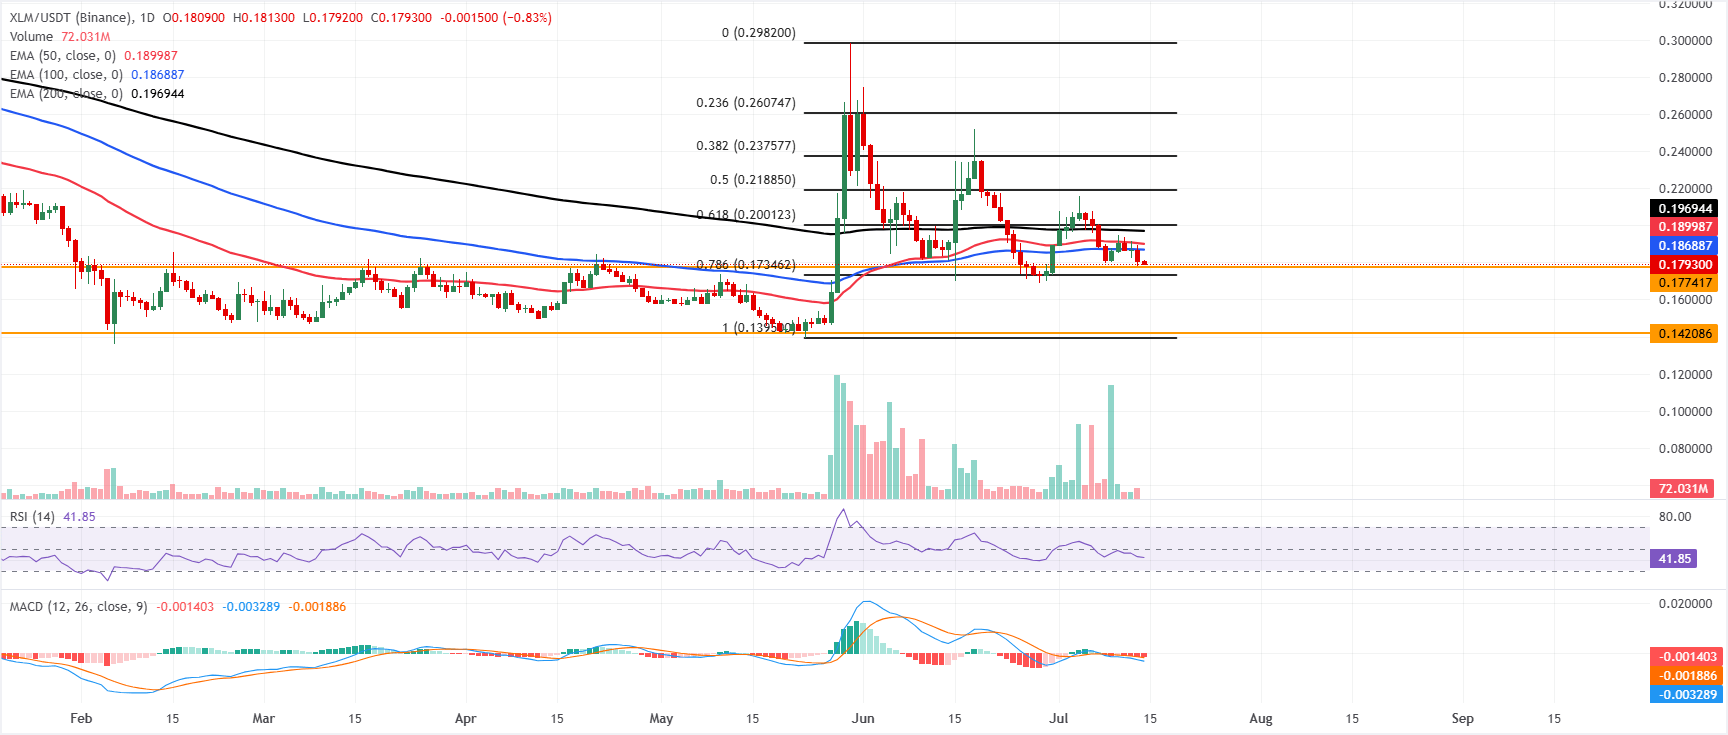
XLM trades at $0.179 on Tuesday, holding below the 50-day, 100-day and 200-day EMAs at $0.190, $0.186 and $0.196, respectively, which keeps the near-term bias bearish.
The RSI at 41 suggests weak momentum, while the MACD remains in negative territory, hinting that rallies are likely to be capped by the clustered EMAs and Fibonacci resistance overhead.
On the downside, initial support appears at the horizontal level around $0.177, followed by the 78.6% Fibonacci retracement at $0.173, with a deeper floor near $0.142.
On the topside, a first hurdle is the 100-day EMA at $0.186, ahead of the 50-day EMA at $0.190 and the 200-day EMA at $0.196; above these, the 61.8% Fibonacci retracement at $0.200 and the mid-range 50% retracement level at $0.218 define subsequent resistance, before $0.237 and $0.260 come into play as higher Fibonacci barriers.
(The technical analysis of this story was written with the help of an AI tool. Know more.)
Nothing in this material constitutes investment advice, personal recommendation, investment research, an offer, or a solicitation to buy or sell any financial instrument. The content has been prepared without consideration of your individual investment objectives, financial situation, or needs, and should not be treated as such.
Past performance is not a reliable indicator of future performance and/or results. Forward-looking scenarios or forecasts are not a guarantee of future performance. Actual results may differ materially from those anticipated.
Mitrade makes no representation or warranty as to the accuracy or completeness of the information provided and accepts no liability for any loss arising from reliance on such information.
Recommended Articles


