

When are the German/ Eurozone flash HCOB PMIs for April and how could they affect EUR/USD?
German/ Eurozone flash PMIs Overview
The preliminary German and Eurozone flash HCOB Purchasing Managers’ Index (PMI) data for April is due for release today at 07:30 and 08:00 GMT, respectively.
Amongst the Euro area economies, the German and the composite Eurozone PMI reports hold more relevance, in terms of their impact on the European currency and the related markets as well.
The flash Composite PMI for Germany is expected to have expanded again, but at a moderate pace due to a slowdown in both the manufacturing and the services sectors. The Composite PMI is seen arriving lower at 51.1 from 51.9 in March.
Germany’s Manufacturing PMI is expected to have fallen to 51.3 from the previous reading of 52.2. Meanwhile, the Services PMI is estimated to have dropped to 50.3 from the prior release of 50.9.
The forecast for the Eurozone flash Composite PMI for April also shows that the overall private sector output expanded at a moderate pace. Eurozone’s manufacturing output growth slowed down, and the services sector activity contracted. A figure below the 50.0 threshold is considered a contraction in the economic activity.
According to preliminary estimates, the Eurozone Composite PMI drops to 50.2 from 50.7 in March. The Manufacturing PMI is seen arriving lower at 50.8 from the prior release of 51.6. The Services PMI is expected to have contracted to 49.8 after slowing down to 50.2 in March.
How could German/ Eurozone flash PMIs affect EUR/USD?
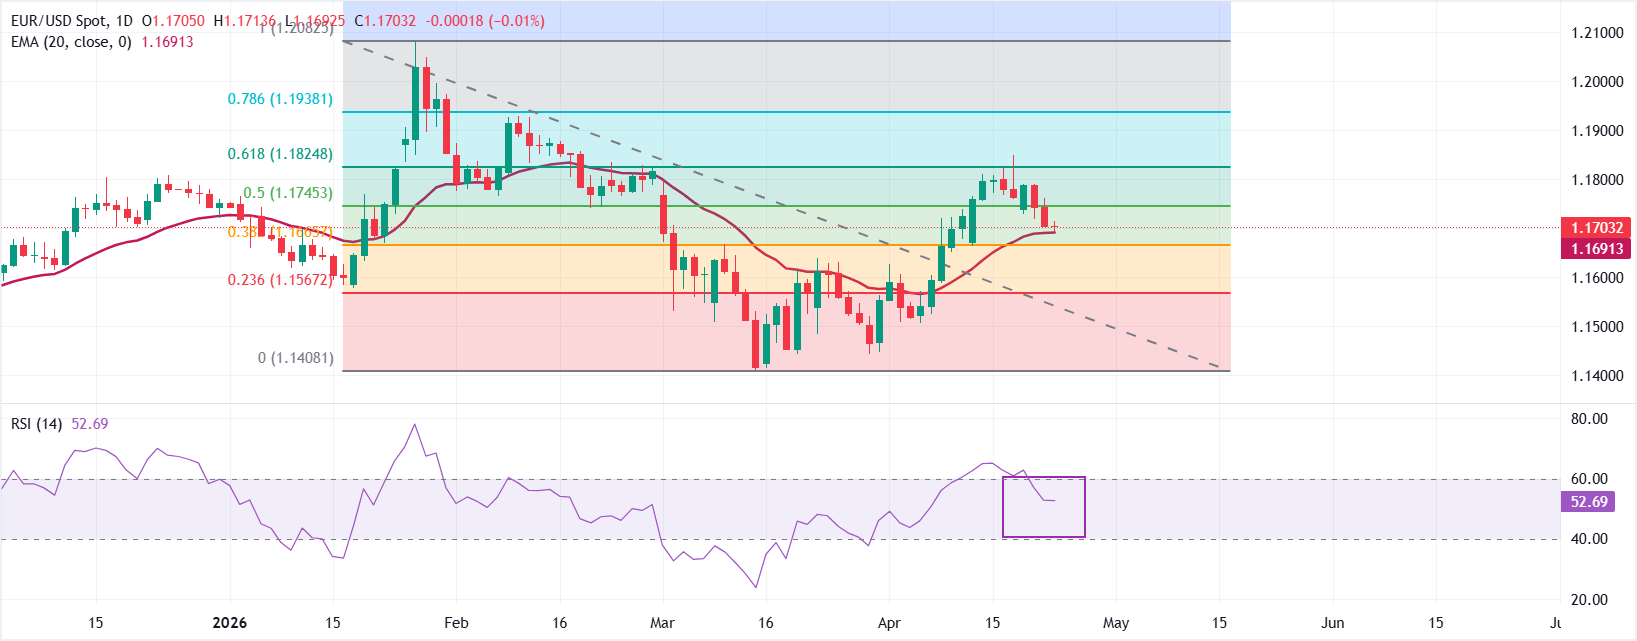
EUR/USD is marginally down to near 1.1700 during the early European trade on Thursday. The pair has corrected to near the 20-period exponential moving average (EMA), which is at 1.1691, but sits north of the 38.2% Fibonacci retracement at 1.1666 of the 1.1408–1.2082 swing, suggesting underlying demand on shallow pullbacks.
The Relative Strength Index (RSI) falls into the 40.00-60.00 zone after failing to hold above the 60.00 level, indicating balanced momentum with an upside bias.
On the topside, initial resistance is located at the 50% Fibonacci retracement at 1.1745; a daily close above this barrier would expose the 61.8% retracement at 1.1825, followed by 1.1938 and the cycle high region near 1.2082. On the downside, immediate support is provided by the 20-period EMA at 1.1691, ahead of the 38.2% retracement at 1.1666; a deeper setback would bring the 23.6% level at 1.1567 into view, with more important structural support down at the 1.1408 swing low.
(The technical analysis of this story was written with the help of an AI tool.)
Economic Indicator
HCOB Composite PMI
The Composite Purchasing Managers Index (PMI), released on a monthly basis by S&P Global and Hamburg Commercial Bank (HCOB), is a leading indicator gauging private-business activity in Germany for both the manufacturing and services sectors. The data is derived from surveys to senior executives. Each response is weighted according to the size of the company and its contribution to total manufacturing or services output accounted for by the sub-sector to which that company belongs. Survey responses reflect the change, if any, in the current month compared to the previous month and can anticipate changing trends in official data series such as Gross Domestic Product (GDP), industrial production, employment and inflation. The index varies between 0 and 100, with levels of 50.0 signaling no change over the previous month. A reading above 50 indicates that the German private economy is generally expanding, a bullish sign for the Euro (EUR). Meanwhile, a reading below 50 signals that activity is generally declining, which is seen as bearish for EUR.
Read more.Next release: Thu Apr 23, 2026 07:30 (Prel)
Frequency: Monthly
Consensus: 51.1
Previous: 51.9
Source: S&P Global
Nothing in this material constitutes investment advice, personal recommendation, investment research, an offer, or a solicitation to buy or sell any financial instrument. The content has been prepared without consideration of your individual investment objectives, financial situation, or needs, and should not be treated as such.
Past performance is not a reliable indicator of future performance and/or results. Forward-looking scenarios or forecasts are not a guarantee of future performance. Actual results may differ materially from those anticipated.
Mitrade makes no representation or warranty as to the accuracy or completeness of the information provided and accepts no liability for any loss arising from reliance on such information.
Recommended Articles


