CFDs are complex instruments and come with a high risk of losing money rapidly due to leverage. 78% of retail investor accounts lose money when trading CFDs with this provider. You should consider whether you understand how CFDs work and whether you can afford to take the high risk of losing your money.

Hyperliquid Price Forecast: HYPE steadies around $40 amid mixed retail outlook

Source Fxstreet
  • Hyperliquid holds steady around $40 on Thursday, after gaining over 3% the previous day.
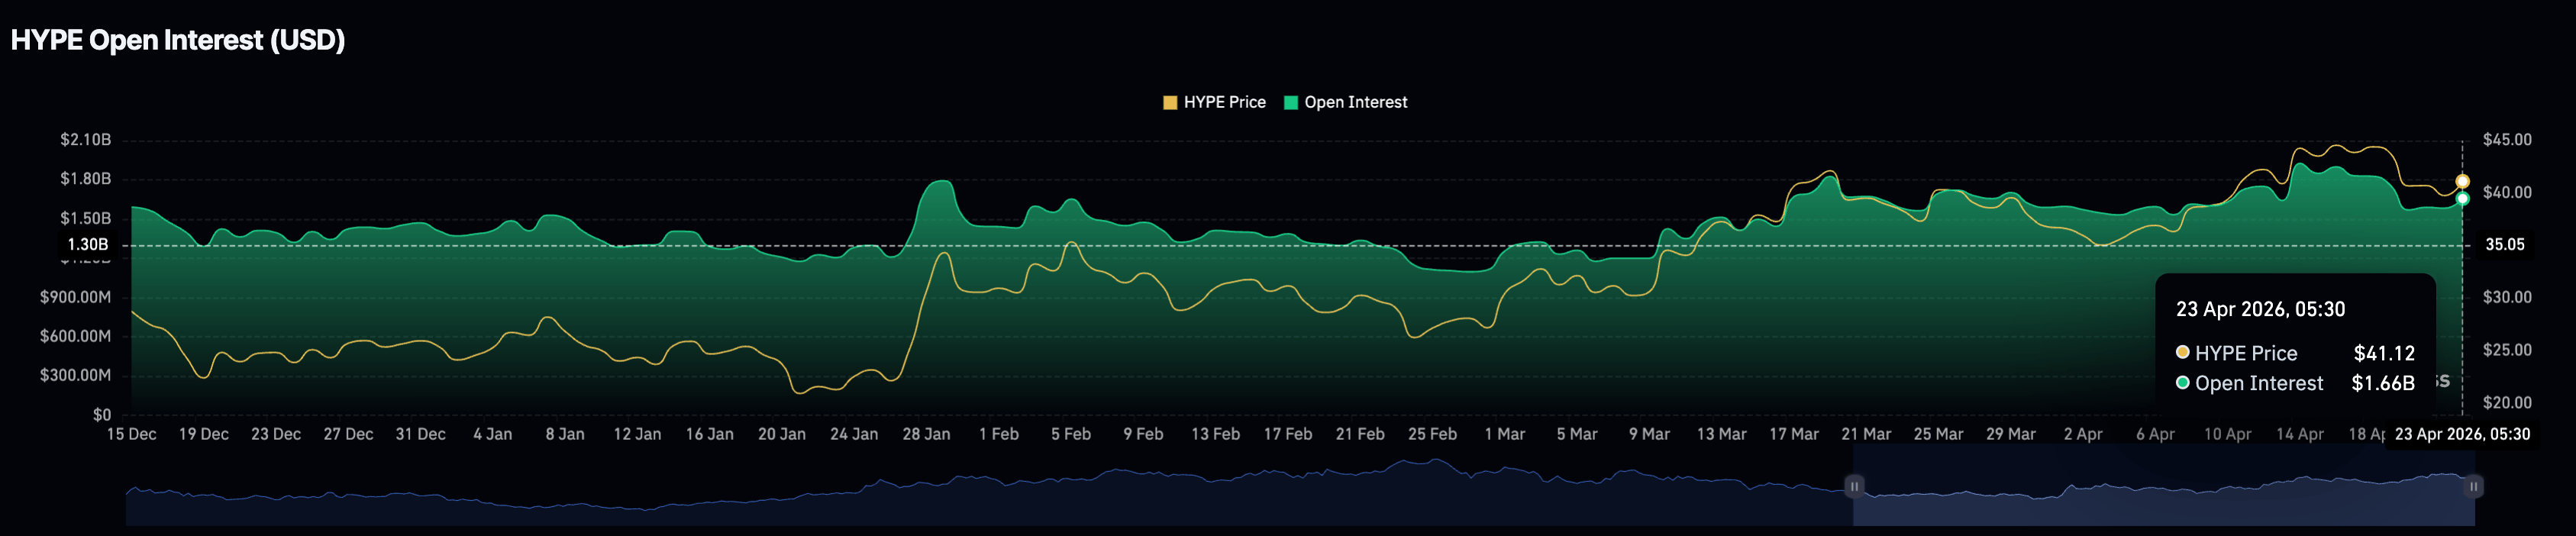
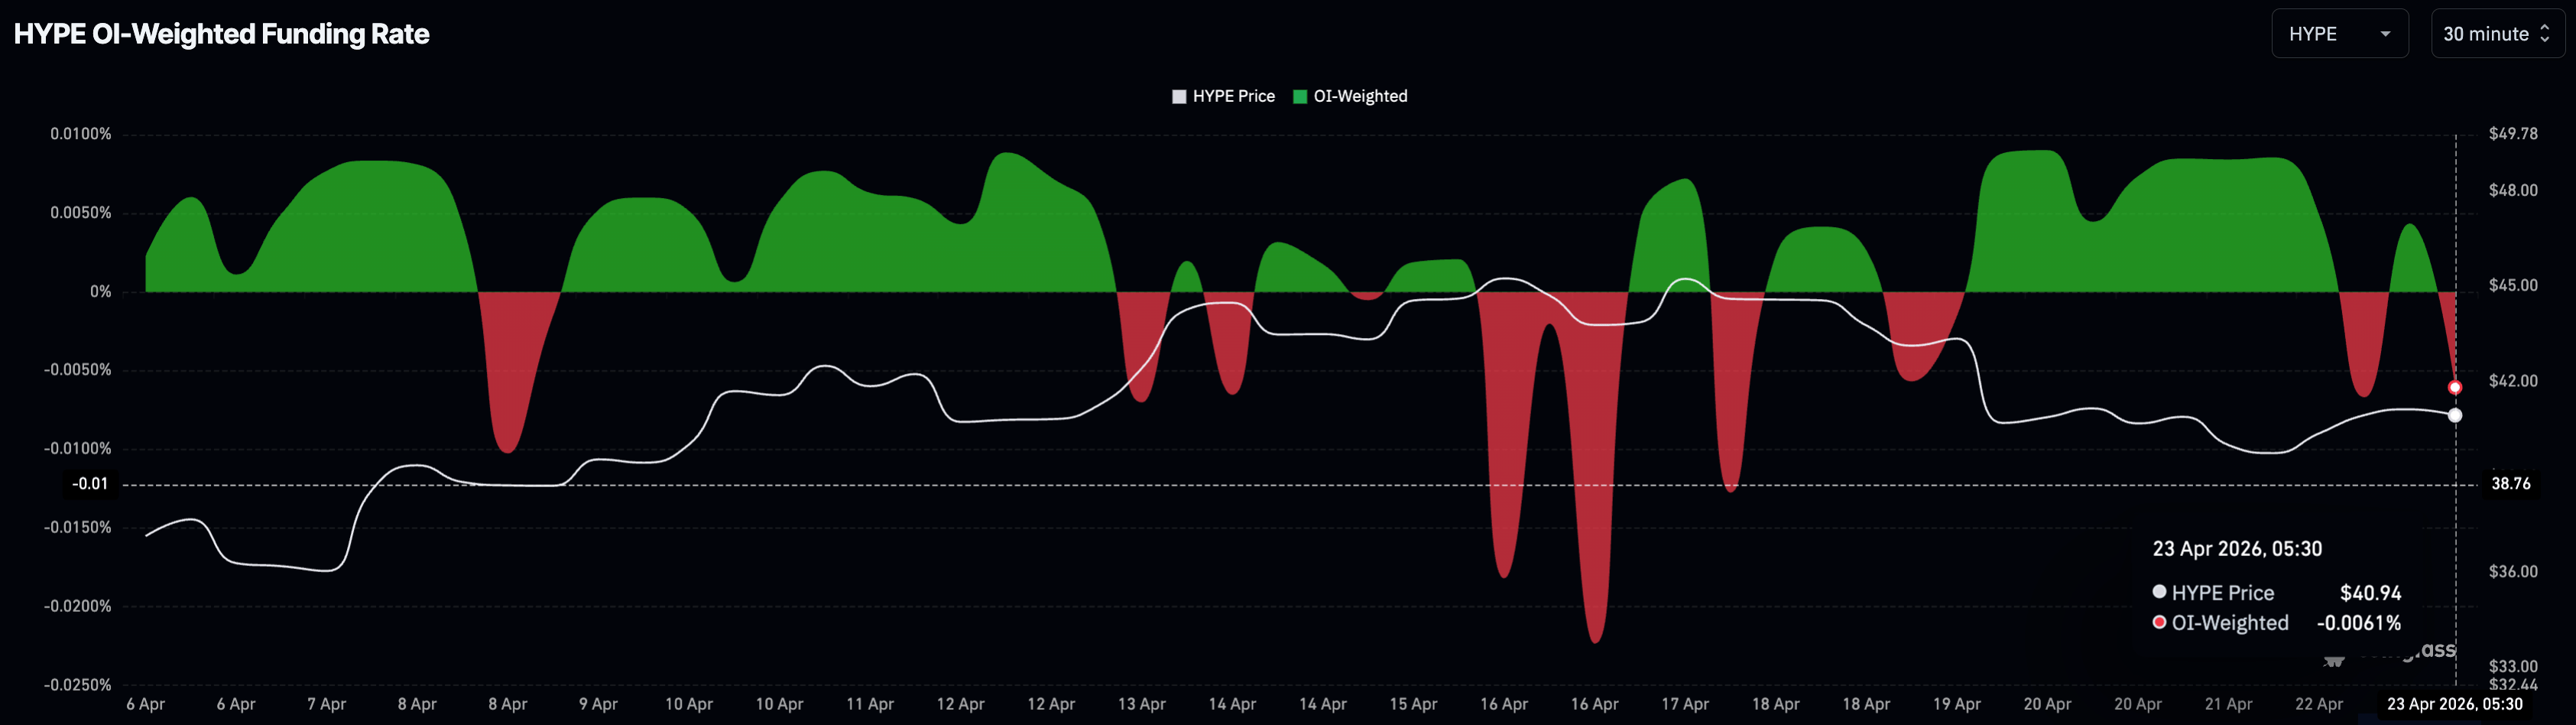
  • Recovering HYPE futures Open Interest, despite negative funding rates, reflects a mixed retail outlook.
  • The technical outlook for HYPE is cautiously optimistic, as the price is forming a rising wedge pattern.

Hyperliquid (HYPE) trades around $40 at press time on Thursday, holding steady after over 3% gains the previous day. The decentralized exchange (DEX) token struggles to retain retail demand in the leverage market, while the technical outlook highlights a rising wedge pattern in the making, keeping the broader bias neutral-to-bearish.

HYPE futures market in limbo

Hyperliquid gained retail traction during the peak of the US-Iran conflict over the Strait of Hormuz, as it provided a 24/7 platform for commodities trading, including Oil and precious metals. However, the easing of pressure in the Middle East, with the US indefinitely extending the deadline for Iran’s peace proposal, aligns with a reduction in retail interest in Hyperliquid.

CoinGlass data shows the HYPE futures Open Interest stands at $1.66 billion, maintaining a broadly sideways trend, suggesting traders' participation is plateauing. However, the funding rate is negative at -0.0061%, indicating that buyers are willing to take short positions at a premium, anticipating a downside in HYPE's price.

HYPE futures Open Interest. Source: CoinGlass
HYPE OI-weighted funding rate. Source: CoinGlass

Will Hyperliquid extend its recovery?

Hyperliquid holds above the 50-day Exponential Moving Average (EMA) near $38.46 and the 200-day EMA at $34.51, while also staying over an ascending support trendline, which collectively keeps the near-term bias tilted to the upside. However, the support trendline forms a rising wedge pattern on the daily chart with an overhead converging trendline, which typically results in a downside breakout.

The Moving Average Convergence Divergence (MACD) sits in negative territory, hinting at waning bullish momentum, but the Relative Strength Index (RSI) at 52 suggests only modest, rather than aggressive, selling pressure at current levels.

On the downside, initial support is located at the rising trendline area near $40.33, where a break would expose the 50-day EMA at $38.46 as the next notable floor, ahead of more distant structural support at the 200-day EMA around $34.51.

Chart Analysis HYPE/USD (baha Crypto)
HYPE/USD daily price chart.

Looking up, the R1 Pivot Point at $43.71 serves as the immediate resistance, guarding the upside to the resistance trendline near $45.77.

(The technical analysis of this story was written with the help of an AI tool.)

Disclaimer: The content available on Mitrade Insights is provided for informational and marketing purposes only. It has not been prepared in accordance with legal requirements designed to promote the independence of investment research and is not subject to any prohibition on dealing ahead of the dissemination of investment research
Nothing in this material constitutes investment advice, personal recommendation, investment research, an offer, or a solicitation to buy or sell any financial instrument. The content has been prepared without consideration of your individual investment objectives, financial situation, or needs, and should not be treated as such.
Past performance is not a reliable indicator of future performance and/or results. Forward-looking scenarios or forecasts are not a guarantee of future performance. Actual results may differ materially from those anticipated.
Mitrade makes no representation or warranty as to the accuracy or completeness of the information provided and accepts no liability for any loss arising from reliance on such information.
placeholder
Top 3 Preisvorhersagen: Bitcoin steigt über 92.000 USD, während Ethereum und Ripple Widerstandsfähigkeit zeigenBitcoin (BTC), Ethereum (ETH) und Ripple (XRP) notieren am Montag im Plus und treiben eine breitere Erholung des Kryptowährungsmarktes voran. Bitcoin und Ethereum setzen ihre Gewinne am zweiten aufeinanderfolgenden Tag fort und überschreiten 92.000 USD bzw. 3.100 USD, während XRP sich nahe 2,00 USD stabilisiert.
Author  FXStreet
Jan 12, Mon
Bitcoin (BTC), Ethereum (ETH) und Ripple (XRP) notieren am Montag im Plus und treiben eine breitere Erholung des Kryptowährungsmarktes voran. Bitcoin und Ethereum setzen ihre Gewinne am zweiten aufeinanderfolgenden Tag fort und überschreiten 92.000 USD bzw. 3.100 USD, während XRP sich nahe 2,00 USD stabilisiert.
placeholder
Crypto Majors Stall as Bitcoin, Ether, and XRP Struggle to Shake Off Bearish OverhangBitcoin steadies at $70k while Ethereum and XRP face key resistance levels; technicals show bearish MACD crossovers despite oversold RSI conditions.
Author  Mitrade
Feb 09, Mon
Bitcoin steadies at $70k while Ethereum and XRP face key resistance levels; technicals show bearish MACD crossovers despite oversold RSI conditions.
placeholder
Silver price today: Silver rises, according to FXStreet dataSilver prices (XAG/USD) rose on Monday, according to FXStreet data. Silver trades at $81.78 per troy ounce, up 5.54% from the $77.48 it cost on Friday.
Author  FXStreet
Feb 09, Mon
Silver prices (XAG/USD) rose on Monday, according to FXStreet data. Silver trades at $81.78 per troy ounce, up 5.54% from the $77.48 it cost on Friday.
placeholder
WTI drops below $64.00, Middle East tensions in focusWest Texas Intermediate (WTI), the US crude oil benchmark, is trading around $63.80 during the early Asian trading hours on Tuesday. The WTI price falls as concerns about supply disruptions in the Middle East have faded.
Author  FXStreet
Feb 10, Tue
West Texas Intermediate (WTI), the US crude oil benchmark, is trading around $63.80 during the early Asian trading hours on Tuesday. The WTI price falls as concerns about supply disruptions in the Middle East have faded.
placeholder
Financial Markets 2026: Volatility Catalysts in Gold, Silver, Oil, and Blue-Chip Stocks—A CFD Trader's OutlookThe financial world is perpetually in motion, but the landscape for 2026 seems to be shaping up to be particularly dynamic. For CFD traders navigating global markets, this heightened volatility could present a distinctive set of challenges and opportunities.
Author  Rachel Weiss
Mar 05, Thu
The financial world is perpetually in motion, but the landscape for 2026 seems to be shaping up to be particularly dynamic. For CFD traders navigating global markets, this heightened volatility could present a distinctive set of challenges and opportunities.
goTop
quote