CFDs are complex instruments and come with a high risk of losing money rapidly due to leverage. 78% of retail investor accounts lose money when trading CFDs with this provider. You should consider whether you understand how CFDs work and whether you can afford to take the high risk of losing your money.

BNB Price Forecast: BNB maintains a constructive tone amid mixed signals

Source Fxstreet
  • BNB is marginally above the 50-day EMA at $633.71 on Thursday, suggesting a slightly constructive near-term tone.
  • Mixed on-chain and derivatives data caps BNB’s upside momentum.
  • The technical outlook suggests an upside potential as momentum indicators signal a bullish bias.

BNB (BNB), formerly known as Binance Coin, trades slightly above the key support zone near $633.71 on Thursday, hinting at a mild constructive near-term tone. Mixed signals from on-chain and derivatives data keep the lid on the upside, while improving momentum indicators suggest a potential bullish move ahead for BNB.

Mixed signals with a slight bullish tilt 

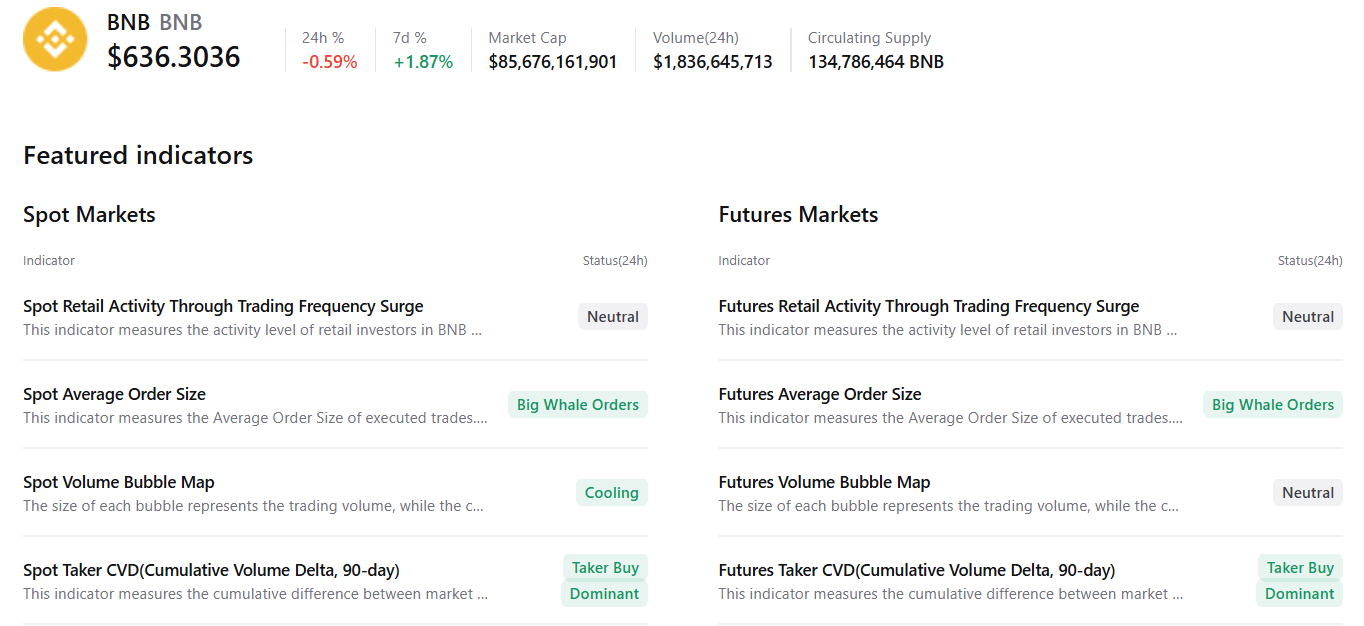
CryptoQuant summary data suggests a bullish outlook for BNB. Spot and futures markets show the presence of large whale orders and buy-side dominance, suggesting a potential upside move.

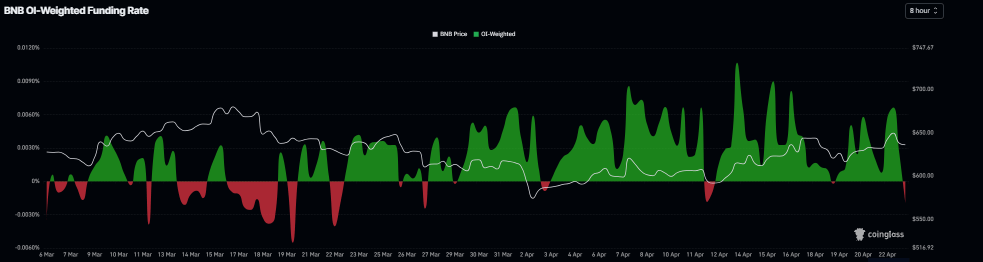
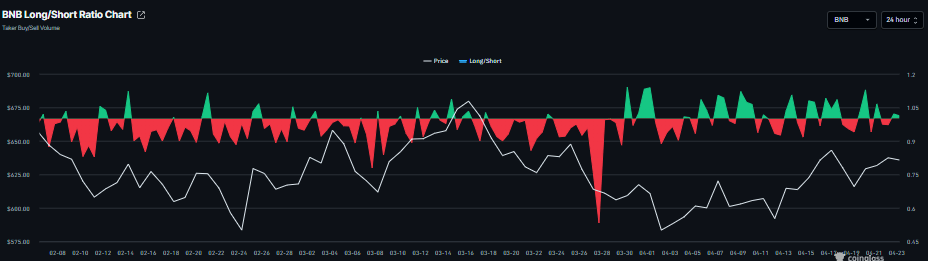
On the derivatives side, sentiment remains mixed. CoinGlass’ OI-Weighted Funding Rate data for Cardano flipped negative on Thursday, reading -0.0019%, indicating that shorts are paying the longs and projecting a bearish outlook. However, the long-to-short ratio reads 1.02 on Thursday, slightly above one, with no clear direction bias in traders’ positioning. 

This combination suggests indecision among BNB investors, limiting the likelihood of a sustained upside move.

BNB funding rates chart. Source: Coinglass
BNB long-to-short ratio chart. Source: Coinglass

BNB Price Forecast: Hovers near key support zone

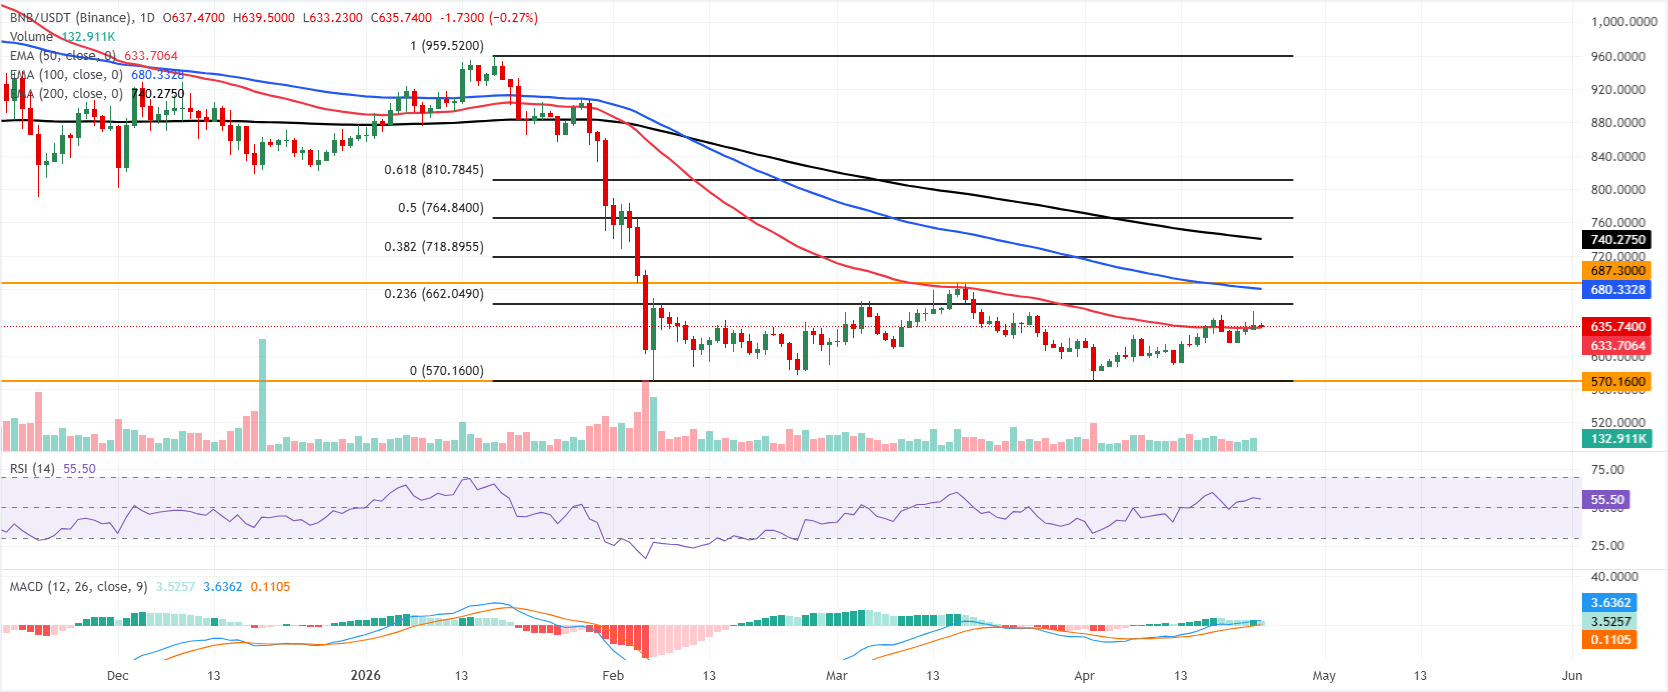
BNB trades at $636.30 on Thursday as it holds marginally above the 50-day Exponential Moving Average (EMA) at $633.71, giving the near-term tone a slightly constructive bias, although the broader structure remains capped by the 100-day EMA at $680.33 and the 200-day EMA at $740.28 overhead.

The Relative Strength Index (RSI) on the daily chart is about 56, leaning positive without signaling overbought conditions, while the Moving Average Convergence Divergence (MACD) remains in positive territory, suggesting buyers retain some control but still face significant overhead supply.

On the topside, initial resistance is aligned with the 23.6% Fibonacci retracement (drawn from January high to February low) at $662.05, followed by the 100-day EMA at $680.33 and the nearby horizontal barrier at $687.30. Above these, the 38.2% Fibonacci retracement at $718.90 and the 200-day EMA at $740.28 form a more substantial medium-term ceiling, ahead of higher retracement hurdles at $764.84 and $810.78.

On the downside, immediate support is provided by the 50-day EMA at $633.71. A break below this level would expose the more distant structural floor around the Fibonacci anchor and horizontal support at $570.16.

(The technical analysis of this story was written with the help of an AI tool.)

Disclaimer: The content available on Mitrade Insights is provided for informational and marketing purposes only. It has not been prepared in accordance with legal requirements designed to promote the independence of investment research and is not subject to any prohibition on dealing ahead of the dissemination of investment research
Nothing in this material constitutes investment advice, personal recommendation, investment research, an offer, or a solicitation to buy or sell any financial instrument. The content has been prepared without consideration of your individual investment objectives, financial situation, or needs, and should not be treated as such.
Past performance is not a reliable indicator of future performance and/or results. Forward-looking scenarios or forecasts are not a guarantee of future performance. Actual results may differ materially from those anticipated.
Mitrade makes no representation or warranty as to the accuracy or completeness of the information provided and accepts no liability for any loss arising from reliance on such information.
placeholder
Top 3 Preisvorhersagen: Bitcoin steigt über 92.000 USD, während Ethereum und Ripple Widerstandsfähigkeit zeigenBitcoin (BTC), Ethereum (ETH) und Ripple (XRP) notieren am Montag im Plus und treiben eine breitere Erholung des Kryptowährungsmarktes voran. Bitcoin und Ethereum setzen ihre Gewinne am zweiten aufeinanderfolgenden Tag fort und überschreiten 92.000 USD bzw. 3.100 USD, während XRP sich nahe 2,00 USD stabilisiert.
Author  FXStreet
Jan 12, Mon
Bitcoin (BTC), Ethereum (ETH) und Ripple (XRP) notieren am Montag im Plus und treiben eine breitere Erholung des Kryptowährungsmarktes voran. Bitcoin und Ethereum setzen ihre Gewinne am zweiten aufeinanderfolgenden Tag fort und überschreiten 92.000 USD bzw. 3.100 USD, während XRP sich nahe 2,00 USD stabilisiert.
placeholder
Crypto Majors Stall as Bitcoin, Ether, and XRP Struggle to Shake Off Bearish OverhangBitcoin steadies at $70k while Ethereum and XRP face key resistance levels; technicals show bearish MACD crossovers despite oversold RSI conditions.
Author  Mitrade
Feb 09, Mon
Bitcoin steadies at $70k while Ethereum and XRP face key resistance levels; technicals show bearish MACD crossovers despite oversold RSI conditions.
placeholder
Silver price today: Silver rises, according to FXStreet dataSilver prices (XAG/USD) rose on Monday, according to FXStreet data. Silver trades at $81.78 per troy ounce, up 5.54% from the $77.48 it cost on Friday.
Author  FXStreet
Feb 09, Mon
Silver prices (XAG/USD) rose on Monday, according to FXStreet data. Silver trades at $81.78 per troy ounce, up 5.54% from the $77.48 it cost on Friday.
placeholder
WTI drops below $64.00, Middle East tensions in focusWest Texas Intermediate (WTI), the US crude oil benchmark, is trading around $63.80 during the early Asian trading hours on Tuesday. The WTI price falls as concerns about supply disruptions in the Middle East have faded.
Author  FXStreet
Feb 10, Tue
West Texas Intermediate (WTI), the US crude oil benchmark, is trading around $63.80 during the early Asian trading hours on Tuesday. The WTI price falls as concerns about supply disruptions in the Middle East have faded.
placeholder
Financial Markets 2026: Volatility Catalysts in Gold, Silver, Oil, and Blue-Chip Stocks—A CFD Trader's OutlookThe financial world is perpetually in motion, but the landscape for 2026 seems to be shaping up to be particularly dynamic. For CFD traders navigating global markets, this heightened volatility could present a distinctive set of challenges and opportunities.
Author  Rachel Weiss
Mar 05, Thu
The financial world is perpetually in motion, but the landscape for 2026 seems to be shaping up to be particularly dynamic. For CFD traders navigating global markets, this heightened volatility could present a distinctive set of challenges and opportunities.
Related Instrument
goTop
quote