

WTI Price Forecast: Returns above 20-day EMA as Hormuz remains closed
- The Oil price posts a fresh weekly high near $93.70 due to the Hormuz closure.
- Iran keeps the Hormuz closed due to the US blockade on Iranian sea ports.
- US President Trump orders to hold military attacks on Iran until Washington receives a unified proposal.
West Texas Intermediate (WTI), futures on NYMEX, trades 2% higher to near $93.70 during the European trading session on Thursday. The Oil price gains as the Strait of Hormuz, a vital passage to almost 20% of global energy supply, remains closed despite a ceasefire extension between the United States (US) and Iran.
The Hormuz remains seized by the Iranian military, as part of retaliation against the US blockade of Iranian sea ports.
On Tuesday, US President Donald Trump announced that military attacks on Iran would remain on hold until Washington receives a unified proposal.
Earlier in the day, the Iranian media said the Islamic Revolutionary Guard Corps (IRGC) fired on three ships in the Hormuz and escorted two of them to Iranian waters, and is bringing those ships to Iran, The Wall Street Journal (WSJ) reported.
WTI technical analysis
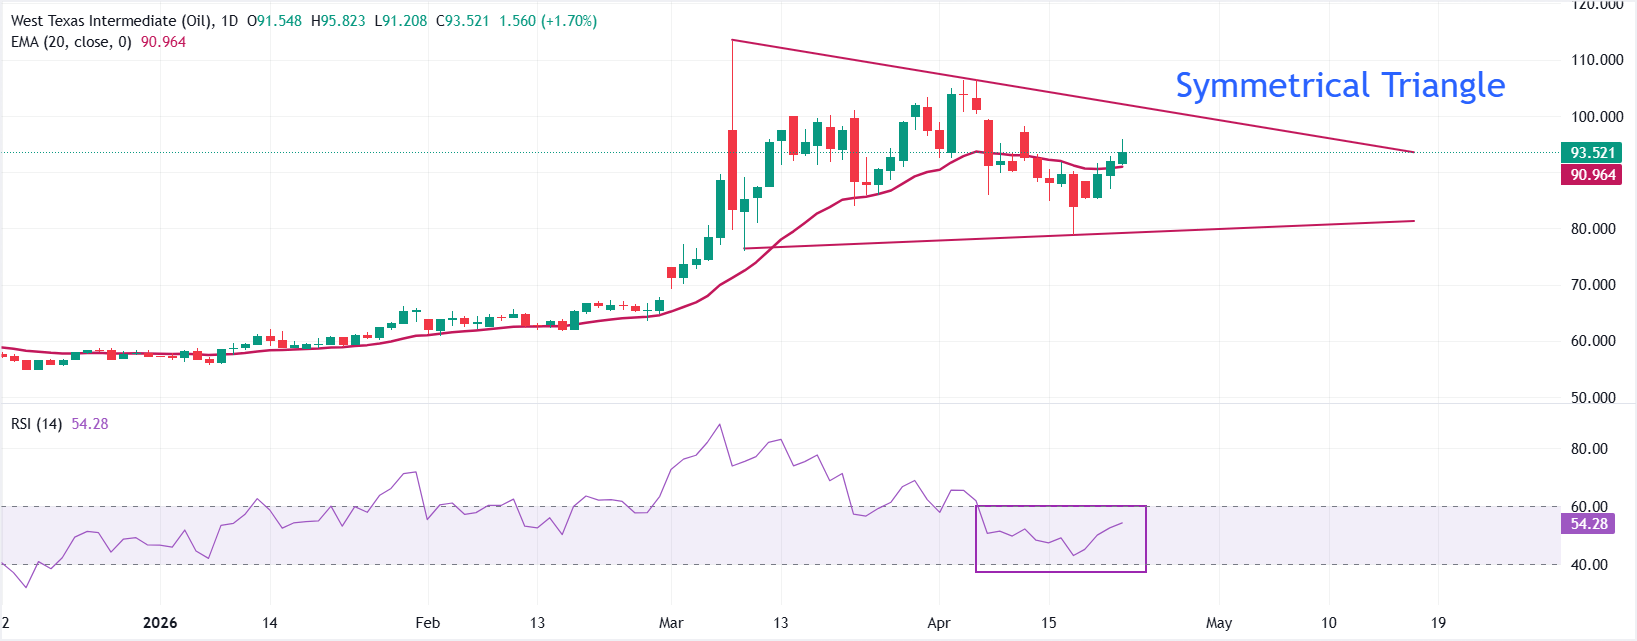
WTI US Oil trades higher at around $93.70 at the press time. The Oil price remains in a constructive near‑term posture as it holds above the 20‑day Exponential Moving Average (EMA) at $90.96 and within an ongoing uptrend defined by the rising support line drawn from $76.42. This positioning suggests dips are being absorbed, while the Relative Strength Index (RSI) at 54 after recovering from around 60.00 indicates a resumption in the upside trend after a healthy correction.
On the topside, the next notable resistance is the descending trend-line region, with a key reference around the prior break area near $100.39, where earlier rallies stalled. Looking down, the immediate support is the 20‑day EMA at $90.96; a daily close below that level would damoen the near-term bullish tone and might lead to a deeper pullback toward the underlying trend support near $79.61.
(The technical analysis of this story was written with the help of an AI tool.)
WTI Oil FAQs
WTI Oil is a type of Crude Oil sold on international markets. The WTI stands for West Texas Intermediate, one of three major types including Brent and Dubai Crude. WTI is also referred to as “light” and “sweet” because of its relatively low gravity and sulfur content respectively. It is considered a high quality Oil that is easily refined. It is sourced in the United States and distributed via the Cushing hub, which is considered “The Pipeline Crossroads of the World”. It is a benchmark for the Oil market and WTI price is frequently quoted in the media.
Like all assets, supply and demand are the key drivers of WTI Oil price. As such, global growth can be a driver of increased demand and vice versa for weak global growth. Political instability, wars, and sanctions can disrupt supply and impact prices. The decisions of OPEC, a group of major Oil-producing countries, is another key driver of price. The value of the US Dollar influences the price of WTI Crude Oil, since Oil is predominantly traded in US Dollars, thus a weaker US Dollar can make Oil more affordable and vice versa.
The weekly Oil inventory reports published by the American Petroleum Institute (API) and the Energy Information Agency (EIA) impact the price of WTI Oil. Changes in inventories reflect fluctuating supply and demand. If the data shows a drop in inventories it can indicate increased demand, pushing up Oil price. Higher inventories can reflect increased supply, pushing down prices. API’s report is published every Tuesday and EIA’s the day after. Their results are usually similar, falling within 1% of each other 75% of the time. The EIA data is considered more reliable, since it is a government agency.
OPEC (Organization of the Petroleum Exporting Countries) is a group of 12 Oil-producing nations who collectively decide production quotas for member countries at twice-yearly meetings. Their decisions often impact WTI Oil prices. When OPEC decides to lower quotas, it can tighten supply, pushing up Oil prices. When OPEC increases production, it has the opposite effect. OPEC+ refers to an expanded group that includes ten extra non-OPEC members, the most notable of which is Russia.
Nothing in this material constitutes investment advice, personal recommendation, investment research, an offer, or a solicitation to buy or sell any financial instrument. The content has been prepared without consideration of your individual investment objectives, financial situation, or needs, and should not be treated as such.
Past performance is not a reliable indicator of future performance and/or results. Forward-looking scenarios or forecasts are not a guarantee of future performance. Actual results may differ materially from those anticipated.
Mitrade makes no representation or warranty as to the accuracy or completeness of the information provided and accepts no liability for any loss arising from reliance on such information.
Recommended Articles


