

EUR/USD hesitates at 1.1700 after mixed Eurozone PMI figures
- EUR/USD hovers right above 1.1700 after dropping 0.7% over the previous two days.
- Mixed Eurozone PMI data have failed to provide support to the Euro.
- The closure of the Strait of Hormuz keeps pushing Oil prices higher, clouding the Eurozone's economic outlook.
The Euro (EUR) posts marginal losses against the US Dollar (USD) on Wednesday, trading at 1.1700 at the time of writing, following mixed Eurozone business activity data for April. The pair consolidates losses after dropping about 0.7% over the previous two days, as investors gradually return to the safe-haven USD amid fading hopes of a swift end to the US-Iran war.
The Eurozone preliminary HCOB Purchasing Managers’ Index (PMI) has shown an unexpected improvement in the manufacturing sector, which has jumped to its highest level in nearly 4 years, at 52.2, from 51.6 in March, beating expectations of a slight pullback to 50.8.
Services activity, on the other hand, has contracted at a 47.4 pace from 50.2 in March, below market expectations of a 49.8 reading. These figures have offset the improvement of manufacturing activity, sending the composite index down to 48.6 from 50.7 in the previous month, also below the 50.2 anticipated by the market’s consensus.
Meanwhile, the closure of the Strait of Hormuz keeps pushing Oil prices higher, and adding pressure to Crude-importing economies like those in the Eurozone. Iran seized two ships on Wednesday, and the US military redirected three Iranian tankers in Asian waters in a tit-for-tat dynamic that is straining an already tense ceasefire.
Later on Thursday, the US weekly Jobless Claims, which are expected to show a moderate pickup in new unemployment benefit recipients, are likely to provide some distraction from the geopolitical scene ahead of the preliminary US S&P Global PMI figures for April.
Technical Analysis: EUR/USD pierces the bullish trendline support
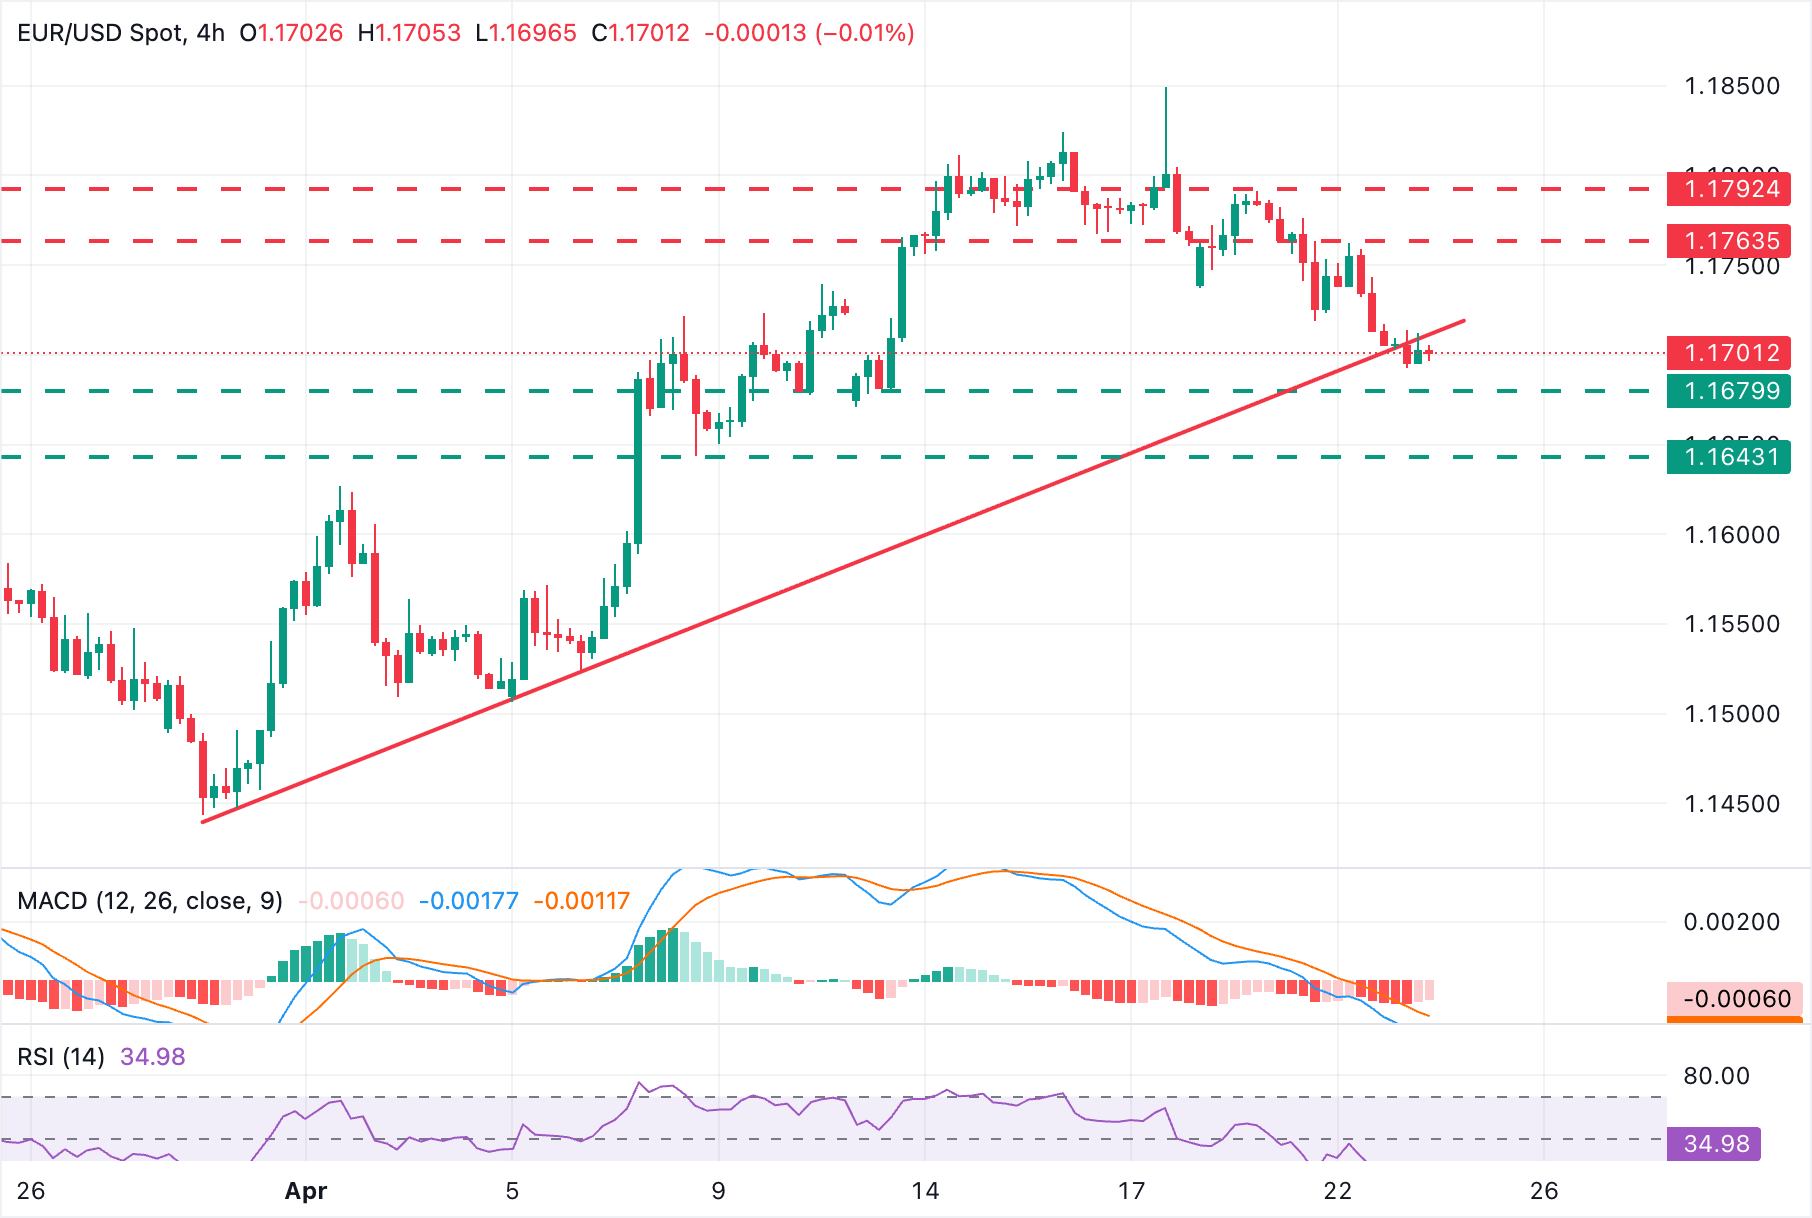
EUR/USD has broken the upward trendline from late-March lows, which now caps the price near 1.1715, leaving recent consolidation vulnerable to further downside. Momentum studies are soft, with the Relative Strength Index (RSI) near 34 and the Moving Average Convergence Divergence (MACD) line remaining below zero, which together hint at an increasing selling pressure.
Below the 1.1700 psychological area, which is now acting as support, bears are likely to focus on the April 10 and 13 lows near 1.1680 and the April 8 low, at 1.1643.
On the upside, a bullish reaction above the mentioned trendline, now around 1.1715, is likely to meet resistance at Wednesday's highs, around 1.1765, and Tuesday's high around 1.1790 ahead of the April peak, near 1.1850.
(The technical analysis of this story was written with the help of an AI tool.)
Economic Indicator
HCOB Manufacturing PMI
The Manufacturing Purchasing Managers Index (PMI), released on a monthly basis by S&P Global and Hamburg Commercial Bank (HCOB), is a leading indicator gauging business activity in the Eurozone manufacturing sector. The data is derived from surveys of senior executives at private-sector companies from the manufacturing sector. Survey responses reflect the change, if any, in the current month compared to the previous month and can anticipate changing trends in official data series such as Gross Domestic Product (GDP), industrial production, employment and inflation. The index varies between 0 and 100, with levels of 50.0 signaling no change over the previous month. A reading above 50 indicates that the manufacturing economy is generally expanding, a bullish sign for the Euro (EUR). Meanwhile, a reading below 50 signals that activity among goods producers is generally declining, which is seen as bearish for EUR.
Read more.Last release: Thu Apr 23, 2026 08:00 (Prel)
Frequency: Monthly
Actual: 52.2
Consensus: 50.8
Previous: 51.6
Source: S&P Global
Economic Indicator
HCOB Services PMI
The Services Purchasing Managers Index (PMI), released on a monthly basis by S&P Global and Hamburg Commercial Bank (HCOB), is a leading indicator gauging business activity in the Eurozone services sector. As the services sector dominates a large part of the economy, the Services PMI is an important indicator gauging the state of overall economic conditions. The data is derived from surveys of senior executives at private-sector companies from the services sector. Survey responses reflect the change, if any, in the current month compared to the previous month and can anticipate changing trends in official data series such as Gross Domestic Product (GDP), industrial production, employment and inflation. The index varies between 0 and 100, with levels of 50.0 signaling no change over the previous month. A reading above 50 indicates that the services economy is generally expanding, a bullish sign for the Euro (EUR). Meanwhile, a reading below 50 signals that activity among services providers is generally declining, which is seen as bearish for EUR.
Read more.Last release: Thu Apr 23, 2026 08:00 (Prel)
Frequency: Monthly
Actual: 47.4
Consensus: 49.8
Previous: 50.2
Source: S&P Global
Nothing in this material constitutes investment advice, personal recommendation, investment research, an offer, or a solicitation to buy or sell any financial instrument. The content has been prepared without consideration of your individual investment objectives, financial situation, or needs, and should not be treated as such.
Past performance is not a reliable indicator of future performance and/or results. Forward-looking scenarios or forecasts are not a guarantee of future performance. Actual results may differ materially from those anticipated.
Mitrade makes no representation or warranty as to the accuracy or completeness of the information provided and accepts no liability for any loss arising from reliance on such information.
Recommended Articles


