

Ge Vernova Inc Stock (GEV) Moved Down by 4.31% on Mar 5: Drivers Behind the Movement
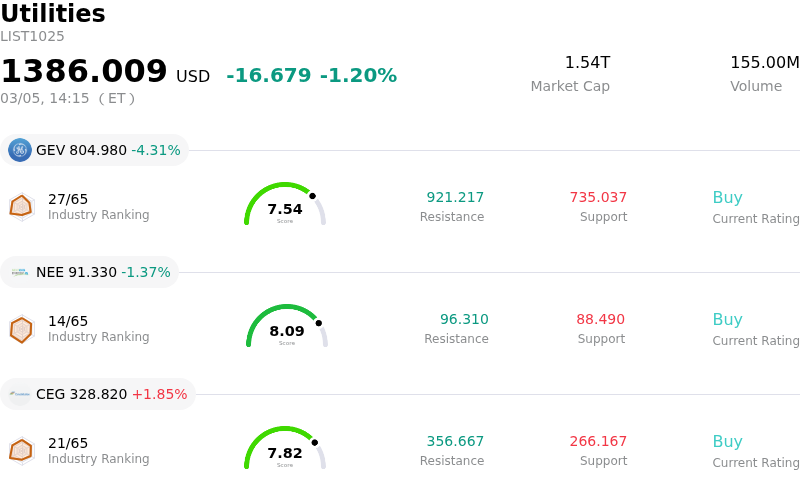
Ge Vernova Inc (GEV) moved down by 4.31%. The Utilities sector is down by 1.20%. The company underperformed the industry. Top 3 stocks by trading volume in the sector: Ge Vernova Inc (GEV) down 4.31%; Nextera Energy Inc (NEE) down 1.37%; Constellation Energy Corp (CEG) up 1.85%.
What is driving Ge Vernova Inc (GEV)’s stock price down today?
GEV experienced a notable decline, primarily influenced by a broader shift in market sentiment and recent macroeconomic indicators, rather than specific negative company developments. The market-wide risk aversion intensified, as evidenced by a significant increase in the Cboe Volatility Index (VIX) over recent days, reflecting investor jitters regarding persistent inflation pressures and ongoing debates within the Federal Reserve concerning potential interest rate adjustments. This heightened volatility typically prompts investors to reduce exposure to equities, particularly those perceived as having reached premium valuations.
Compounding this cautious sentiment, recent labor market data points to a cooling economy. The ADP Non-Farm Employment Change report, released yesterday, indicated a substantial slowdown in private sector job additions for February, falling short of market expectations. While official government non-farm payroll figures are still pending, the preliminary data suggests a weakening in hiring momentum, which can be interpreted by some as a sign of economic deceleration. This, coupled with concerns from Federal Reserve officials that inflation remains elevated, creates an environment of uncertainty regarding future monetary policy.
Despite these broader market headwinds, GEV has recently reported several positive company-specific developments. These include a declared increase in its quarterly dividend, an expanded share repurchase authorization, and robust financial results from its fourth quarter, which exceeded analyst expectations for both earnings and revenue. The company also recently completed a significant acquisition and launched new software solutions aimed at accelerating growth in its Electrification segment, driven by strong demand linked to AI data centers. Many analysts hold a positive outlook for GEV, with a consensus rating of "Buy" or "Strong Buy" and elevated price targets.
However, some analyses have highlighted GEV's valuation, noting that the stock trades at a substantial premium relative to its peers and historical levels. In a climate of increased market caution, highly valued stocks can be more susceptible to downward pressure as investors re-evaluate risk and seek safer assets. Therefore, while GEV's operational and financial trajectory remains strong, its recent price movement is likely a reflection of broader market sentiment turning more cautious amidst macroeconomic data, influencing investors to take profits or reduce holdings in high-multiple names.
Technical Analysis of Ge Vernova Inc (GEV)
Technically, Ge Vernova Inc (GEV) shows a MACD (12,26,9) value of [42.08], indicating a neutral signal. The RSI at 60.16 suggests neutral condition and the Williams %R at -51.44 suggests oversold condition. Please monitor closely.
Fundamental Analysis of Ge Vernova Inc (GEV)
Ge Vernova Inc (GEV) is in the Utilities industry. Its latest annual revenue is $38.07B, ranking 2 in the industry. The net profit is $4.88B, ranking 3 in the industry. Company Profile
Over the past month, multiple analysts have rated the company as Buy, with an average price target of $845.03, a high of $1087.00, and a low of $424.45.
More details about Ge Vernova Inc (GEV)
Company Specific Risks:
- Analysts and recent valuation checks indicate that GE Vernova's stock may be significantly overvalued, with a Discounted Cash Flow (DCF) analysis suggesting a 36.9% overvaluation and its P/E ratio of 48.21x being substantially higher than the electrical industry average, raising concerns about a potential market correction.
- The company faces ongoing headwinds in its offshore wind segment, which is expected to pressure margins in the coming quarters due to factors such as project delays and tariff uncertainties, impacting overall profitability.
- An executive officer of GE Vernova sold 4,000 common shares for $3.48 million on February 26, 2026, and a Form 144 filing on March 2, 2026, indicated additional share sales tied to restricted vesting.
Nothing in this material constitutes investment advice, personal recommendation, investment research, an offer, or a solicitation to buy or sell any financial instrument. The content has been prepared without consideration of your individual investment objectives, financial situation, or needs, and should not be treated as such.
Past performance is not a reliable indicator of future performance and/or results. Forward-looking scenarios or forecasts are not a guarantee of future performance. Actual results may differ materially from those anticipated.
Mitrade makes no representation or warranty as to the accuracy or completeness of the information provided and accepts no liability for any loss arising from reliance on such information.
Recommended Articles


