

KLA Corp Stock (KLAC) Moved Down by 5.04% on Mar 5: A Full Analysis
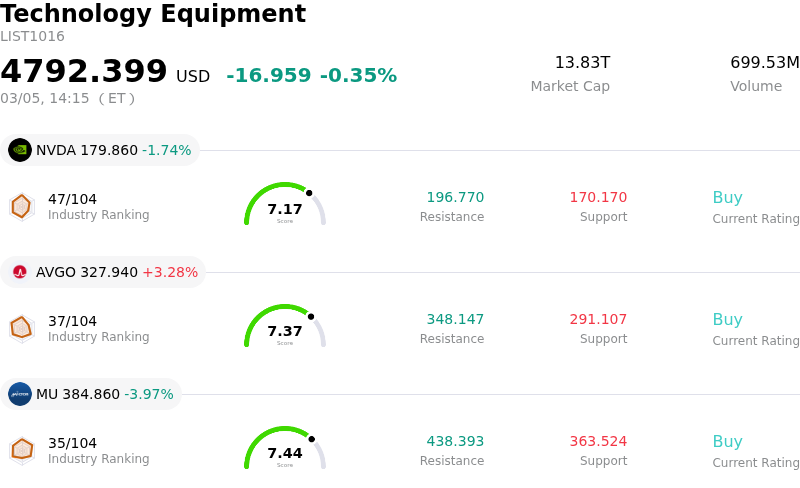
KLA Corp (KLAC) moved down by 5.04%. The Technology Equipment sector is down by 0.35%. The company underperformed the industry. Top 3 stocks by trading volume in the sector: NVIDIA Corp (NVDA) down 1.74%; Broadcom Inc (AVGO) up 3.28%; Micron Technology Inc (MU) down 3.97%.
What is driving KLA Corp (KLAC)’s stock price down today?
KLA Corporation (KLAC) experienced a downward movement, primarily influenced by a broader downturn across the semiconductor sector. This sector-wide decline is largely attributed to escalating geopolitical tensions, specifically involving Iran, which have raised concerns about a potential energy price shock, particularly affecting liquefied natural gas (LNG) supplies. The ripple effect of these geopolitical events has impacted semiconductor manufacturers globally, leading to selling pressure on KLA and other companies in the industry.
While KLA had reported strong Q2 2026 earnings and provided a positive outlook for the March quarter, projecting consistent growth and outperforming the market in 2026 driven by multiple tailwinds, these company-specific positives appear to have been overshadowed by broader market anxieties. Analyst sentiment for KLAC has generally been positive, with many maintaining "Buy" ratings and upward revisions to earnings estimates for the current fiscal year. However, the current situation highlights the semiconductor market's volatility and its susceptibility to external macroeconomic and geopolitical factors, even for companies with strong fundamentals.
Additionally, some analyses point to weak near-term sentiment for KLAC that could precede shifts in its mid and long-term outlook, despite more bullish long-term signals from AI models. Concerns were also noted in late January regarding investor anxiety over the company's wafer fab equipment outlook compared to competitors, along with potential margin drag from rising DRAM component costs and tariffs. Recent market analyses have also suggested that KLA Corporation shares may be overvalued according to some discounted cash flow models, potentially contributing to a price correction risk.
Technical Analysis of KLA Corp (KLAC)
Technically, KLA Corp (KLAC) shows a MACD (12,26,9) value of [23.01], indicating a neutral signal. The RSI at 50.73 suggests neutral condition and the Williams %R at -67.25 suggests oversold condition. Please monitor closely.
Fundamental Analysis of KLA Corp (KLAC)
KLA Corp (KLAC) is in the Technology Equipment industry. Its latest annual revenue is $12.16B, ranking 15 in the industry. The net profit is $4.06B, ranking 11 in the industry. Company Profile
Over the past month, multiple analysts have rated the company as Buy, with an average price target of $1669.51, a high of $1900.00, and a low of $1388.00.
More details about KLA Corp (KLAC)
Company Specific Risks:
- KLA Corporation experienced a 5.43% stock decline on March 3rd, driven by a broader semiconductor sector downturn stemming from escalating geopolitical tensions and concerns over potential energy price shocks.
- Analysts forecast a decrease in KLA-Tencor's market share within the Wafer Fabrication Equipment (WFE) process control segment to 6-7% by 2026, which is expected to limit future revenue potential due to unfavorable market shifts.
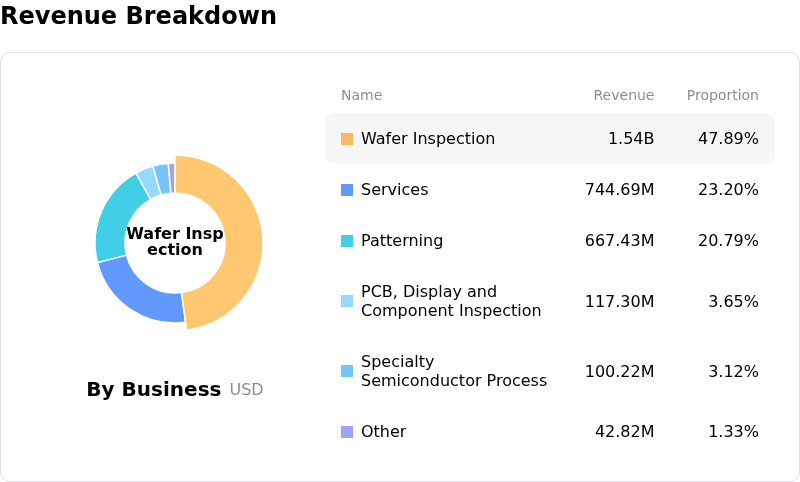
- Decreasing revenue contribution from the China market, which has dropped from 39% to 30% of total sales, raises concerns about the company's overall profitability and market positioning.
- Analyst commentary highlights concerns regarding a multi-quarter deceleration in top-line growth and anticipated margin contraction, partially attributed to rising DRAM component costs and tariffs.
Nothing in this material constitutes investment advice, personal recommendation, investment research, an offer, or a solicitation to buy or sell any financial instrument. The content has been prepared without consideration of your individual investment objectives, financial situation, or needs, and should not be treated as such.
Past performance is not a reliable indicator of future performance and/or results. Forward-looking scenarios or forecasts are not a guarantee of future performance. Actual results may differ materially from those anticipated.
Mitrade makes no representation or warranty as to the accuracy or completeness of the information provided and accepts no liability for any loss arising from reliance on such information.
Recommended Articles


