




Trump Coin Price Forecast 2026: Current price, critical price zones, and potential scenarios for TRUMP. Analysis of token supply, Long, Short, and risks.
The Trump Coin continues to register multi-million trading volume and exhibits a market capitalization of around 500 million. Throughout the entire year of 2026, the price has shown no particular soaring highs.
What suggests a certain forecast: Investors trust the President and holding his asset more than the asset actually possesses market value.
We analyze the Trump Coin in our current price, value, and market forecast.
Snapshot: What is the Trump Coin?
Trump Coin Live Price:
*Invest in crypto from just 1 € – Regulated & reliable, with Euro deposits!*
Cryptocurrencies are volatile and can lead to losses.Regulated under CySEC standards.
The Trump Coin is a business, but also an idea. A speculative object, an experiment, and a political symbol.
The idea behind it originated prior to January 17, 2025, but only became official through Donald Trump's own announcement. Offering cryptocurrencies as a fan-base option is not new. It is a so-called memecoin based on the Solana blockchain.
In total, one billion of these coins were created, of which 200 million were publicly issued in an Initial Coin Offering (ICO).
These trading fees are a decisive factor, as a portion of them flows directly back to the "creators of the coin." The goal is obvious: generating revenue.
The idea behind the Trump Coin:
Capitalizing on Trump's popularity and supporters
Building a community of Trump supporters
A tradable digital collectible whose price depends on supply, demand, and expectations
Behind this lies a well-known game: Trump polarizes like hardly any other politician. His name alone is enough to mobilize a community. The developers of the Trump Coin knew this as well. The coin was, moreover, developed on a somewhat lesser-known platform named Meteora.
Current Developments Around the Trump Coin
For valuation, two questions are thus at the center: How does demand evolve beyond media events, and how much additional supply actually becomes tradable?
Because currently, reference to Trump, his statements, and his political decisions no longer seems to give the price any new momentum.
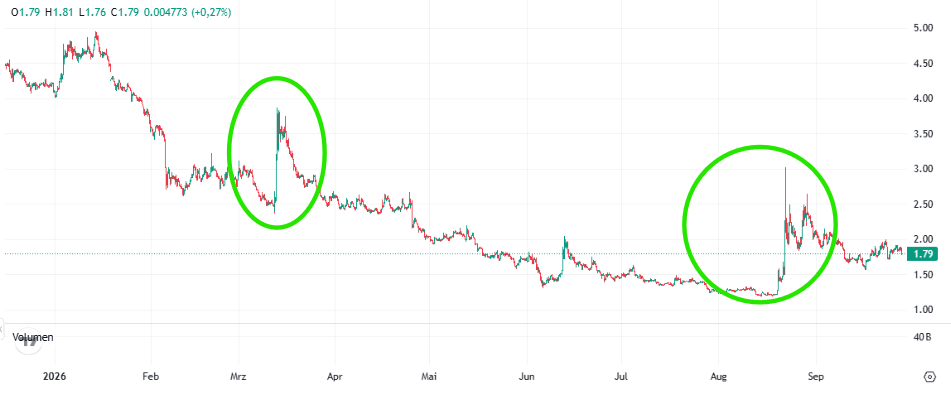
There were merely two price rallies, which subsequently collapsed again over the course of weeks. Gains could hardly be found here for investors.
What Moves the Trump Coin Forecast for 2026?
One must acknowledge that a well-known name is not yet a price engine. The crypto market remains active, but with the handbrake on. Many investors therefore use volatility as a speculative strategy. Short-term price fluctuations may also be traded through CFD platforms like Mitrade.
Trump continues to provide talking points. However, this does not necessarily generate demand for his memecoin. Because whoever welcomes a political decision does not have to purchase a TRUMP token by any means.
Trump Coin Forecast: Price Trajectory and Price Development in Check
Current Trump Coin Forecast Points Downward
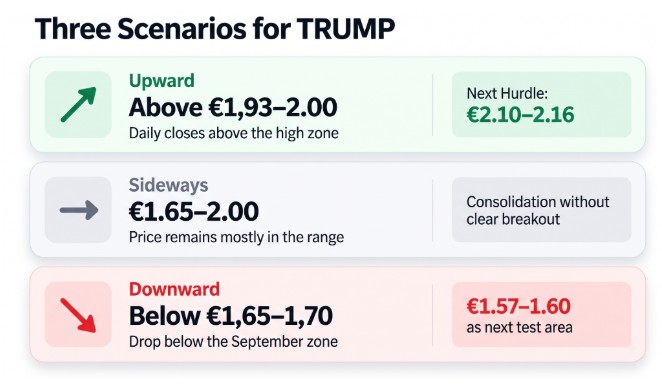
We view a drop below the support level of €1.65–€1.70 as a potential signal for a renewed negative trend. If the price falls significantly below this range, a retrace toward €1.57–€1.60 would be plausible. In a pessimistic scenario, the previous low zones around €1.37–€1.40 and €1.18–€1.21 could subsequently be tested.
Neutral Scenario
In the neutral scenario, no strong recovery is assumed. Even with the preservation of the token, it currently looks as though the coin will continue to fall. TRUMP would rather move long-term in a lower range between approximately 1.40 and 1.90 US Dollars.
This fits the current market picture: The coin recently traded several times in the range of approximately 2.00 to 2.20 US Dollars, but could not sustain higher levels.
Optimistic Scenario
The optimistic scenario is also deliberately restrained. It merely assumes that TRUMP recovers temporarily and rises up to around €3.51 by the end of 2030 in the event of a stronger overall market or renewed political attention.
For that, demand, trading volume, and market sentiment would need to increase significantly more, while selling pressure from token unlocks would simultaneously remain limited.
The annual figures are illustrative model assumptions, not calculated price targets from the chart.
Image/Table for informational and illustrative purposes. The original Dollar assumptions were converted using the ECB reference rate of September 25, 2026: €1 = $1.1403. This exchange rate remains constant for all model years.
Price basis: TradingView, TRUMP/EUR (Kraken trading venue), daily close as of September 27, 2026 (UTC), closing price €1.867. The price zones are proprietary derivations from the high- and low-price areas of the chart. Cross-check: CoinMarketCap, daily close as of September 27, 2026, converted at €1.87 with the underlying ECB rate. Both sources accessed on October 16, 2026. The annual values are illustrative model assumptions, not calculated price targets from the chart
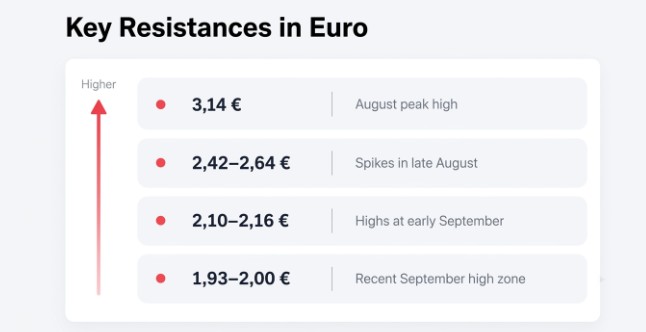
.On the upside, TRUMP would first need to overcome the €1.93–€2.00 area with high trading volume. Only after that would an increase toward €2.10–€2.16 become technically more credible; without sufficient demand, any recovery remains vulnerable to pullbacks.
Beyond 2029: A Coin as an Homage?
After Trump's second term in office, the question arises whether the coin will continue to have relevance. Should a loyal community form around the coin, however, it could continue to exist as a symbolic memento or fan project.
For a concrete forecast through 2030, this thought is not sufficient. Reliable metrics regarding future demand and utilization are lacking. Fame cannot simply be calculated into a token price.

Trump Coin Technical Analysis: Price Action, Supports, and Resistances
Following the September low at €1.57, the coin initially recovered. Subsequently, it retreated from the area just under €2.00 back to about €1.69. The prevailing price during the renewed retrieval, by contrast, stood at around €1.78 – €1.80.
Trump Coin Supports (Support Zones)
The forecasts describe areas in which the price previously behaved conspicuously. Naturally, they do not form solid walls. Especially with a memecoin, new headlines can quickly pierce such zones. Currently, however, we would set the supports here.
Trump Coin Resistances (Resistance Zones)
Trend indicators so far reflect stabilization rather than euphoria. Based on closed Euro daily candles, the simple 20-day moving average sits around €1.78, and the 50-day moving average sits around €1.75. The last closed daily price of €1.867 lies above them. The RSI calculated according to Wilder over 14 periods stands at approximately 53 and is thus in neutral territory.
This fits a recovery after the correction. For a clearer uptrend, closing prices above the most recent high zone are still lacking.
Trump Coin Trading: What Long and Short Change
We are speaking here about a coin whose price thrives heavily on expectations. For trading, an additional question arises: Is the token itself held, or a position on its price movement (i.e., its rise or fall)?
When buying, the asset lies in a wallet. A CFD, by contrast, reflects the price difference between opening and closing. The coin itself does not migrate into one's own wallet.
Rising or falling prices with Trump: The calculation works in both directions:
Long: The position wins if the TRUMP price rises.
Short: The position wins if the TRUMP price falls.
This allows two scenarios to be mapped: a breakout above resistance or a breakdown of important support. Which movement actually occurs remains open.
At a price around approximately 2 US Dollars, a movement of 10% can therefore make a significant difference: An increase to 2.20 US Dollars would favor a Long position; a decline to 1.80 US Dollars, by contrast, a Short position. With a leveraged position, these movements have an even stronger impact.
The high volatility range also means: A short-term price increase is not automatically a sustainable trend. Likewise, a decline does not immediately have to lead to a further selling wave. With the TRUMP coin, technical levels, news, and market sentiment can change very quickly.
Is the Trump Coin Frenzy Over?
The Trump Coin has experienced considerable price fluctuations since its inception. The big speculative wave seems to be over. Although the token continues to trade and currently even experiences a 24-hour trading volume of around 300 million Euro again, we nevertheless see short-term, hype-driven spikes rather than a bull run.
Recent daily prices show how non-linear development remains: A strong August move was followed in September by a correction and subsequently a partial recovery.
What does this mean for the forecast?
The Trump Coin remains interesting.
TRUMP behaves characteristically for political memecoins: extreme launch hype, then rapid profit-taking and prolonged sideways to downward phases.
Short-term price spikes (e.g., +20% late August 2026) are mostly driven by election rumors or political headlines, but rarely last.
Is anything left of the "frenzy"?
The token remains a watched asset for traders wagering on political news and memecoin volatility.
Forecasts range from very conservative to highly speculative scenarios, yet these rely heavily on assumptions about market sentiment and political events.
Primarily a political speculation token with high risk.
Trump Coin and Its (Curious) Token Distribution
One must also make an effort to look behind the curtain with the Trump Coin. Because out of a total of one billion tokens, 80% are allocated to the companies CIC Digital LLC and Fight Fight Fight LLC. CIC Digital is connected to the Trump Organization. At launch, merely 200 million tokens were available; the remaining holdings are subject to a tiered three-year vesting schedule.
This structure is decisive for price development. With each unlock, additional tokens can enter the market. If they are sold, sufficient demand must exist to absorb the growing supply. Otherwise, additional selling pressure can arise.
Heavy Losses and Unequally Distributed Profits
How differently the results turn out for buyers is demonstrated by an evaluation from Nansen published by CoinDesk in July 2026. According to this, 988,905 out of approximately 1.48 million buyer wallets examined were in a loss. Their combined losses amounted to 3.81 billion USD. Simultaneously, profitable wallets recorded profits totaling 4.04 billion USD, which were concentrated primarily among early buyers.
Wallets do not automatically correspond to individual persons. The figures therefore prove neither that nearly one million retail investors were affected, nor a net loss across all buyers of 3.81 billion USD.
Political Criticism of the Structure
The connection between political office and private crypto businesses has also triggered investigations and criticism in the US Congress. Senator Richard Blumenthal opened an investigation in May 2025 into potential conflicts of interest and foreign influence. In doing so, he compared the development to known pump-and-dump patterns.
Risk Management: How Much Depends on a Single Move?
A good trading strategy alone is not enough. Without solid risk management, even experienced investors can suffer heavy losses. It must therefore be clear that when trading this coin, one thing counts above all: risk management tools.
Stop-Loss Placement:
A Stop-Loss triggers the closure of a position as soon as a set threshold is reached. With Long, such a loss limit typically lies below the entry price; with Short, above it. The set threshold is not a price guarantee. According to Mitrade's execution policy, execution occurs at the best available price. During rapid moves or price gaps, this may turn out less favorable. The stop limits the planned leeway of a position; it does not make the market predictable.
Position Sizing:
How strongly a move impacts the account also depends on position size. With 100 token units and a €0.10 distance to the stop, this mathematically results in €10 of risk before costs. Provided execution occurs exactly at the threshold.
Diversification: More Coins, Same Market Direction?:
Multiple cryptocurrencies can fall simultaneously during a stress phase. Distributing across different coins therefore does not prevent losses. Stablecoins also bring their own issuer, liquidity, and potentially currency risks.
What About the Melania Coin?
The so-called Melania Meme Coin, which arose in the orbit of the Trump Coin, briefly attracted attention and temporarily also made it into the top 10 political meme coins. In the meantime, however, it has dropped far down—both regarding market capitalization and trading volume. Many analysts meanwhile consider the project a short-lived hype without substance, whose relevance was heavily dependent on media cycles surrounding the Trump family.
Deception Instead of Transparency: The Fake Coins
The situation remains particularly critical regarding unofficial copycat coins that attempt to enrich themselves from the hype around Trump and Melania. Many of these coins advertise using names, images, or quotes from the Trump family—without any legal connection or authorization.
A familiar face and an active social media channel prove no authenticity. For identification, the network and the token address published on the official project page count. On Solana, it is: 6p6xgHyF7AeE6TZkSmFsko444wqoP15icUSqi2jfGiPN
The project page also names its own TRON address. An identical ticker symbol alone is therefore not sufficient to equate tokens across different networks.
Trump Coin Insights: Who Profits from the Trading?
Donald Trump profits from the Official Trump Coin not only when the price rises. Money also flows to companies associated with him via the sale and trading of the token as well as via licensing and participation agreements.
Revenue Even with Falling Prices:
The price of the coin does not need to rise permanently for Trump and affiliated companies to generate income. According to Reuters, the TRUMP project generated approximately 1.2 billion US Dollars in revenue since launch. Reuters estimates that roughly 616 million US Dollars of this went to the Trump family.
Concluding Thoughts
Trump turned political prominence into a tradable digital symbol. Whether sustainable demand arises from this remains the decisive question. The distance to the all-time high shows how far public attention and economic results can diverge.
For the 2026 forecast, we therefore view it as an object of speculation, and that will most likely remain the case in the future.

 Trading fees from €0Flexible leverage, small positionsDeposits and withdrawals in EuroMinimum deposit from €1

Disclaimer & Risk Warning: This content is provided for informational and marketing purposes only and does not constitute investment advice, financial research, or a personal recommendation. Past performance is not a reliable indicator of future results. Consider your financial circumstances and risk tolerance before trading.
CFDs are complex instruments and come with a high risk of losing money rapidly due to leverage. 83% of retail investor accounts lose money when trading CFDs with this provider. You should consider whether you understand how CFDs work and whether you can afford to take the high risk of losing your money.


