

Ge Vernova Inc Stock (GEV) Moved Up by 3.52% on Mar 18: What Signal Does It Send?
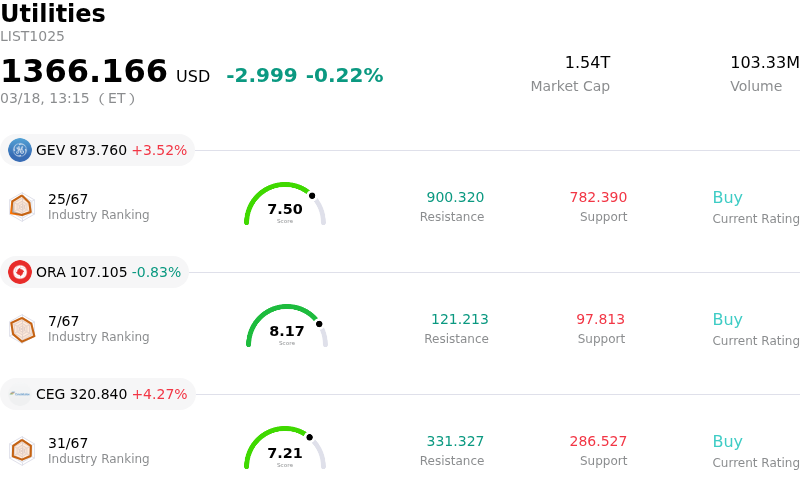
Ge Vernova Inc (GEV) moved up by 3.52%. The Utilities sector is down by 0.22%. The company outperformed the industry. Top 3 stocks by turnover in the sector: Ge Vernova Inc (GEV) up 3.52%; Ormat Technologies Inc (ORA) down 0.83%; Constellation Energy Corp (CEG) up 4.27%.
What is driving Ge Vernova Inc (GEV)’s stock price up today?
GEV experienced an increase today, reflecting a continuation of positive momentum driven by several key factors. A significant driver for the stock's performance is the overwhelmingly positive sentiment from financial analysts. Numerous research firms have issued "Buy" or "Strong Buy" ratings, with many having recently upgraded their recommendations and increased price targets. This widespread bullish outlook among analysts signals strong confidence in the company's future prospects.
The company's strong financial performance and optimistic guidance also underpin investor enthusiasm. GE Vernova recently reported robust fourth-quarter earnings for 2025, surpassing both earnings per share and revenue estimates. Following this, the company raised its full-year 2026 revenue guidance well above analyst consensus and lifted its free cash flow projections, indicating a solid financial trajectory. Additionally, the company declared a quarterly dividend, with the ex-dividend date being yesterday, March 17th.
Strategic developments, particularly in high-growth segments, are also contributing to the upward trend. GE Vernova recently announced a Memorandum of Understanding with Hitachi to explore the deployment of BWRX-300 small modular reactors in Southeast Asia. This collaboration highlights the company's commitment to expanding its nuclear energy footprint and tapping into new growth opportunities. Furthermore, the company continues to benefit from strong demand for its gas turbines and electrification equipment, largely driven by the accelerating expansion of data centers and the increasing need for reliable power infrastructure globally. The demand for gas turbine capacity is particularly strong, with slots largely sold out through 2028.
Despite these strong positive catalysts, the stock experienced significant intraday volatility. This could be attributed to ongoing concerns related to the performance of its wind segment, which is still projected to incur operational losses and project delays. Valuation concerns, with the stock trading at rich multiples compared to industry peers, may also contribute to periods of profit-taking and price fluctuations. Nevertheless, the prevailing analyst opinion and recent fundamental improvements suggest an underlying ascending dynamic for GEV.
Technical Analysis of Ge Vernova Inc (GEV)
Technically, Ge Vernova Inc (GEV) shows a MACD (12,26,9) value of [22.58], indicating a neutral signal. The RSI at 56.43 suggests neutral condition and the Williams %R at -42.48 suggests oversold condition. Please monitor closely.
Fundamental Analysis of Ge Vernova Inc (GEV)
Ge Vernova Inc (GEV) is in the Utilities industry. Its latest annual revenue is $38.07B, ranking 2 in the industry. The net profit is $4.88B, ranking 4 in the industry. Company Profile
Over the past month, multiple analysts have rated the company as Buy, with an average price target of $865.83, a high of $1100.00, and a low of $424.45.
More details about Ge Vernova Inc (GEV)
Company Specific Risks:
- GE Vernova faces persistent operational losses and project delays within its wind power segment, including an anticipated revenue hit of approximately $250 million and potential losses of $400 million in 2026 due to installation challenges at the Vineyard Wind project.
- The company is exposed to significant vulnerabilities in its complex global supply networks, with ongoing disruptions in raw material availability and logistical delays expected to adversely impact production timelines and elevate input costs.
- Multiple key executives, including the Chief People Officer, Chief Commercial & Operations Officer, and CEO of the Power Segment, engaged in share sales on March 4, 2026, which may signal a lack of internal confidence or forthcoming negative developments.
- Independent analysis indicates that GE Vernova's stock valuation is rich compared to industrial peers, with high multiples and weaker operating margins, suggesting limited upside potential and increasing risk of profit-taking if growth decelerates.
Nothing in this material constitutes investment advice, personal recommendation, investment research, an offer, or a solicitation to buy or sell any financial instrument. The content has been prepared without consideration of your individual investment objectives, financial situation, or needs, and should not be treated as such.
Past performance is not a reliable indicator of future performance and/or results. Forward-looking scenarios or forecasts are not a guarantee of future performance. Actual results may differ materially from those anticipated.
Mitrade makes no representation or warranty as to the accuracy or completeness of the information provided and accepts no liability for any loss arising from reliance on such information.
Recommended Articles


