

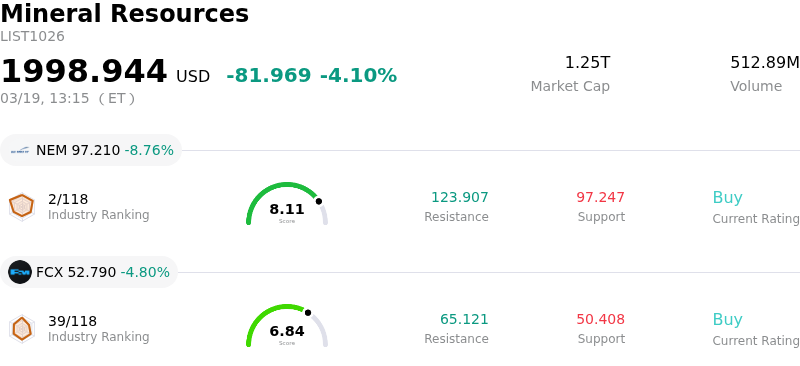
Newmont Corporation Stock (NEM) Moved Down by 8.76% on Mar 19: Drivers Behind the Movement
Newmont Corporation (NEM) moved down by 8.76%. The Mineral Resources sector is down by 4.10%. The company underperformed the industry. Top 3 stocks by turnover in the sector: Newmont Corporation (NEM) down 8.76%; Freeport-McMoRan Inc (FCX) down 4.80%; Barrick Mining Ord Shs (B) down 6.95%.
What is driving Newmont Corporation (NEM)’s stock price down today?
Newmont Corporation's stock experienced significant downward movement today, driven by a confluence of macroeconomic factors and company-specific concerns. A primary catalyst was the notable decline in gold prices, which saw a sharp reduction across global markets. This downturn in the precious metal's value is largely attributed to the Federal Reserve's recent policy announcement.
The Federal Reserve's decision to maintain current interest rates and signal a limited number of rate cuts for the upcoming year bolstered the U.S. dollar. A stronger dollar typically exerts downward pressure on gold, as it makes the commodity more expensive for holders of other currencies. This sentiment, combined with persistent inflation worries and rising oil prices, prompted profit-taking in the gold market, directly impacting gold mining companies like Newmont.
Adding to the negative sentiment, Newmont's previously issued 2026 guidance has raised concerns among investors. The company's outlook projects a decrease in attributable gold production and anticipates higher all-in sustaining costs for the year. This expected "trough year," characterized by lower output and increased expenses, implies a potential squeeze on profit margins, making the stock particularly sensitive to any weakness in gold prices.
Further contributing to the downward pressure was news of an executive's recent sale of a substantial number of company shares. While this transaction was reportedly part of a routine trading plan, insider selling can sometimes amplify negative market sentiment, especially during periods of broader market or sector weakness.
Overall, the stock's performance reflects a combination of external macroeconomic forces impacting the price of its core commodity and internal operational guidance, which together have generated investor apprehension. Market sentiment also appears to be turning more pessimistic, as evidenced by increased activity in put options.
Technical Analysis of Newmont Corporation (NEM)
Technically, Newmont Corporation (NEM) shows a MACD (12,26,9) value of [-0.81], indicating a sell signal. The RSI at 35.36 suggests neutral condition and the Williams %R at -95.42 suggests oversold condition. Please monitor closely.
Fundamental Analysis of Newmont Corporation (NEM)
Newmont Corporation (NEM) is in the Mineral Resources industry. Its latest annual revenue is $22.67B, ranking 8 in the industry. The net profit is $7.08B, ranking 3 in the industry. Company Profile
Over the past month, multiple analysts have rated the company as Buy, with an average price target of $137.07, a high of $177.00, and a low of $64.32.
More details about Newmont Corporation (NEM)
Company Specific Risks:
- Projected nearly 10% decrease in gold production for 2026, signaling a "trough" year with direct implications for future revenue generation.
- Anticipated significant increase in all-in sustaining costs (AISC) to $1680 per ounce for 2026, primarily due to higher royalties and taxes, which is expected to compress profit margins.
- Disclosure of insider share selling activities, including a Newmont executive's sale of 18,394 shares on March 16, 2026, potentially signaling internal concerns.
- Uncertainty surrounding a notice of default related to the Nevada Gold Mines joint venture, which could impact a significant portion of the company's output.
Nothing in this material constitutes investment advice, personal recommendation, investment research, an offer, or a solicitation to buy or sell any financial instrument. The content has been prepared without consideration of your individual investment objectives, financial situation, or needs, and should not be treated as such.
Past performance is not a reliable indicator of future performance and/or results. Forward-looking scenarios or forecasts are not a guarantee of future performance. Actual results may differ materially from those anticipated.
Mitrade makes no representation or warranty as to the accuracy or completeness of the information provided and accepts no liability for any loss arising from reliance on such information.
Recommended Articles


