

USD/CHF Price Forecast: Rejected at 200-day SMA, drops towards 0.7900
- USD/CHF falls 0.31% to 0.7906 despite SNB attempts to weaken the Swiss Franc.
- Break below 0.7897 exposes downside toward 0.7800 and 0.7750 support levels.
- RSI signals bullish momentum may resume if buyers reclaim levels above 0.7950.
The USD/CHF trades more softly during the North American session despite the Swiss National Bank (SNB)'s efforts to intervene verbally in the forex markets to depreciate the Swiss Franc. Broad US Dollar weakness pushed the major down 0.31% to 0.7906.
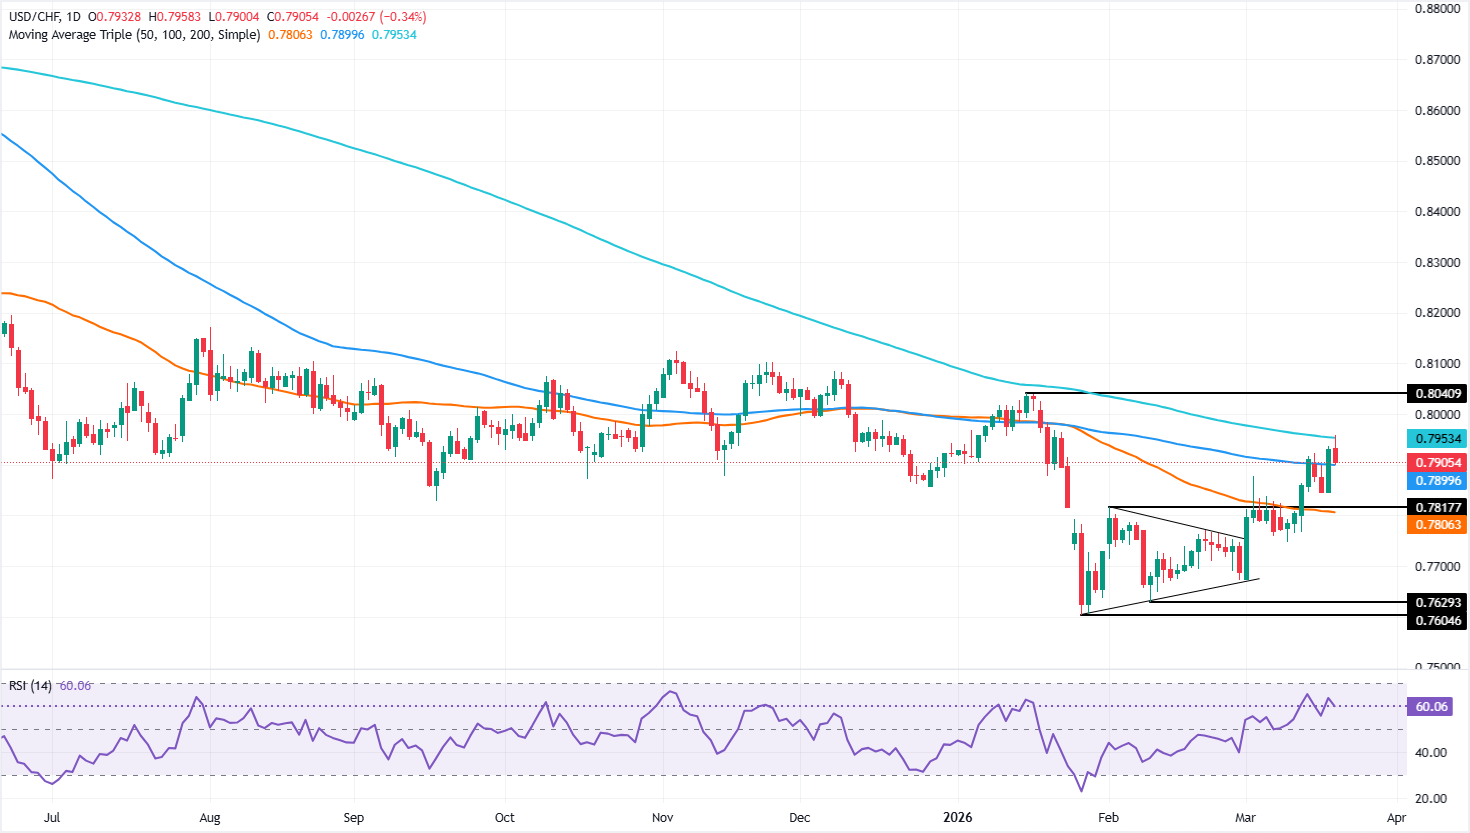
USD/CHF Price Forecast: Technical outlook
The technical picture shows that USD/CHF buyers emerged at around 0.7830, pushing the pair higher amid US Dollar strength on Wednesday. The pair hit an eight-week high at 0.7957, slightly above the 200-day Simple Moving Average (SMA) at 0.7951, which increased the chances for further upside.
Since then, the USD/CHF has retreated towards the 0.79 level, but short-term momentum seems poised for further gains, as indicated by the Relative Strength Index (RSI).
Conversely, if USD/CHF falls below the 100-day SMA at 0.7897, it opens the path to test the 50-day SMA at 0.7800. On further weakness, the next area of interest would be the March 6 daily low of 0.7750.
USD/CHF Price Chart – Daily
Swiss Franc Price This week
The table below shows the percentage change of Swiss Franc (CHF) against listed major currencies this week. Swiss Franc was the strongest against the Canadian Dollar.
| USD | EUR | GBP | JPY | CAD | AUD | NZD | CHF | |
|---|---|---|---|---|---|---|---|---|
| USD | -1.18% | -1.21% | -1.09% | 0.06% | -0.89% | -0.99% | 0.04% | |
| EUR | 1.18% | -0.01% | 0.02% | 1.24% | 0.29% | 0.18% | 1.23% | |
| GBP | 1.21% | 0.00% | 0.17% | 1.25% | 0.31% | 0.18% | 1.30% | |
| JPY | 1.09% | -0.02% | -0.17% | 1.18% | 0.20% | 0.13% | 1.16% | |
| CAD | -0.06% | -1.24% | -1.25% | -1.18% | -0.99% | -1.03% | -0.01% | |
| AUD | 0.89% | -0.29% | -0.31% | -0.20% | 0.99% | -0.12% | 0.94% | |
| NZD | 0.99% | -0.18% | -0.18% | -0.13% | 1.03% | 0.12% | 1.01% | |
| CHF | -0.04% | -1.23% | -1.30% | -1.16% | 0.01% | -0.94% | -1.01% |
The heat map shows percentage changes of major currencies against each other. The base currency is picked from the left column, while the quote currency is picked from the top row. For example, if you pick the Swiss Franc from the left column and move along the horizontal line to the US Dollar, the percentage change displayed in the box will represent CHF (base)/USD (quote).
Nothing in this material constitutes investment advice, personal recommendation, investment research, an offer, or a solicitation to buy or sell any financial instrument. The content has been prepared without consideration of your individual investment objectives, financial situation, or needs, and should not be treated as such.
Past performance is not a reliable indicator of future performance and/or results. Forward-looking scenarios or forecasts are not a guarantee of future performance. Actual results may differ materially from those anticipated.
Mitrade makes no representation or warranty as to the accuracy or completeness of the information provided and accepts no liability for any loss arising from reliance on such information.
Recommended Articles


