

Solana (SOLUSD) Volatility Intensified on Jun 24: What You Should Know
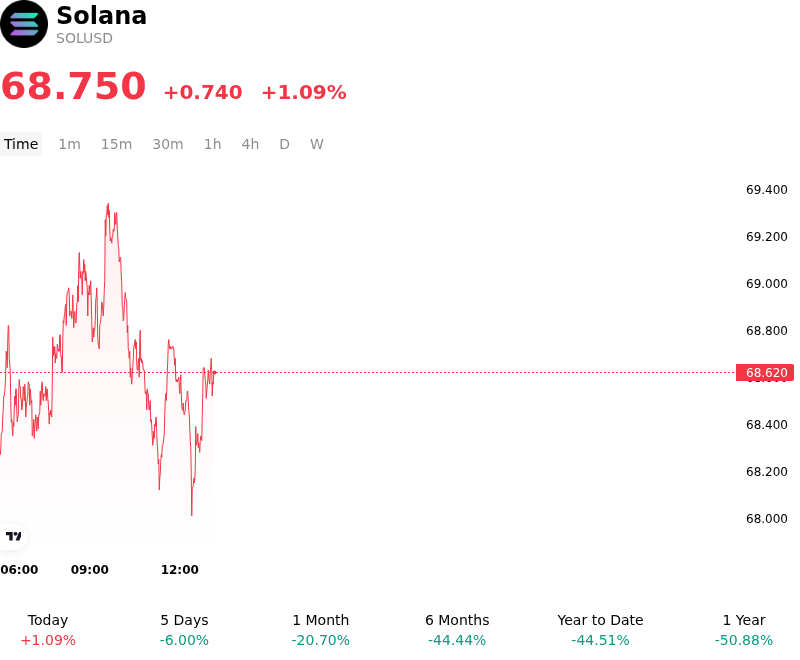
Solana (SOLUSD) is up 1.09% at Jun 24 01:10(ET), now at $68.75, with a 7-day down of 3.44%.
What is driving Solana (SOLUSD)’s stock price up today?
Solana experienced heightened intraday volatility with a positive bias as robust institutional catalysts and real-world asset integration clashed with a broader tech-driven market correction. On the institutional front, Morgan Stanley's amended S-1 filing for its spot Solana ETF served as a major catalyst. Offering a highly competitive 0.14% sponsor fee and integrating native staking capabilities through major custody providers, the filing signaled significant Wall Street confidence in the asset's structural longevity. This development built upon the strong momentum of the existing US spot Solana ETF cohort, which had already attracted over $1.1 billion in cumulative net inflows since launching in late May.
On-chain dynamics and enterprise adoption further supported the token's valuation. Allfunds integrated its €1.8 trillion tokenized funds platform with Solana, allowing asset managers to issue and distribute fund shares directly on-chain. Simultaneously, payments giant MoneyGram joined the network as an active validator and partnered with the Solana Developer Platform, demonstrating a deep protocol-level commitment. These milestones occurred alongside Solana's dominance in the real-world asset sector, with the network capturing nearly the entirety of decentralized tokenized equity volume, fueled by high-profile secondary market listings such as tokenized SpaceX shares.
However, these strong structural narratives were countered by challenging macroeconomic headwinds that limited a sustained breakout. A Nasdaq-led technology selloff, triggered by profit-taking in the semiconductor sector, imported systematic risk into the digital asset class. Hawkish monetary policy sentiment, highlighted by elevated bond yields and the Federal Reserve's firm stance on interest rates, also prompted institutional de-risking away from high-beta assets. While these macro factors triggered leverage washouts and heightened intraday volatility across the market, Solana's strong fundamental backstop enabled it to absorb the selling pressure and secure a modest positive session.
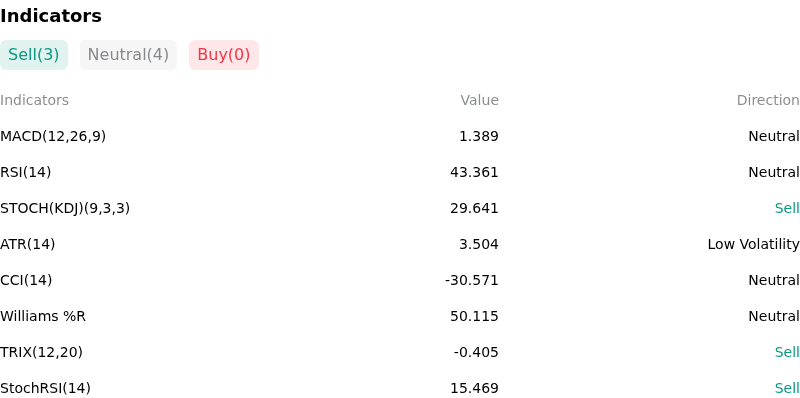
Technical Analysis of Solana (SOLUSD)
Technically, Solana (SOLUSD) shows a MACD (12,26,9) value of 1.389, indicating a neutral signal. The RSI at 43.361 suggests neutral condition and the Williams %R at 50.115 suggests neutral condition. Please monitor closely.
More details about Solana (SOLUSD)
Recent Events and Risks:
- Aggressive Whale Shorting and Exchange Inflows: A prominent crypto whale ("0x9137") opened a highly leveraged 20x short position on 554,680 SOL (valued at approximately $38.15 million), signaling aggressive bearish positioning. This is compounded by on-chain data showing roughly 600,000 SOL flowing into centralized exchanges, indicating that traders are preparing to sell or hedge against further downside.
- Institutional Capitulation and ETF Outflows: Institutional sentiment has been severely damaged following recent regulatory disclosures that Goldman Sachs completely liquidated its entire $108 million spot Solana ETF and trust holdings. This structural capitulation—coupled with a drop in long-term holder supply from 3.27 million to 2.36 million SOL—has triggered net capital outflows from US-listed spot Solana exchange-traded funds and depressed the token’s price below the psychological $70 threshold.
- Technical Breakdown and Double-Top Pattern: After failing to sustain a recovery above the $74–$75 resistance zone, SOL’s price has completed a bearish double-top rejection and a rising wedge breakdown on the short-term charts. Now trading near $68, a failure to defend the immediate $67 support zone leaves the token highly vulnerable to a sharp correction back to its early-June low of $60, with technical analysts warning of a deeper slide toward $50 if selling intensifies.
- Hawkish Macro Pressures and Legislative Friction: Broad market de-risking has intensified following hawkish statements from Fed Chair Kevin Warsh, which have driven up bond yields and prompted institutional capital to withdraw from high-beta crypto assets like Solana. Concurrently, escalating legislative debates in the U.S. Senate over Section 604 of the CLARITY Act have introduced fresh compliance anxieties regarding the regulatory classification of non-custodial developers and validator pools on the network.
Nothing in this material constitutes investment advice, personal recommendation, investment research, an offer, or a solicitation to buy or sell any financial instrument. The content has been prepared without consideration of your individual investment objectives, financial situation, or needs, and should not be treated as such.
Past performance is not a reliable indicator of future performance and/or results. Forward-looking scenarios or forecasts are not a guarantee of future performance. Actual results may differ materially from those anticipated.
Mitrade makes no representation or warranty as to the accuracy or completeness of the information provided and accepts no liability for any loss arising from reliance on such information.
Recommended Articles


