



Ge Vernova Inc Stock (GEV) Moved Down by 3.53% on Jul 16: A Full Analysis
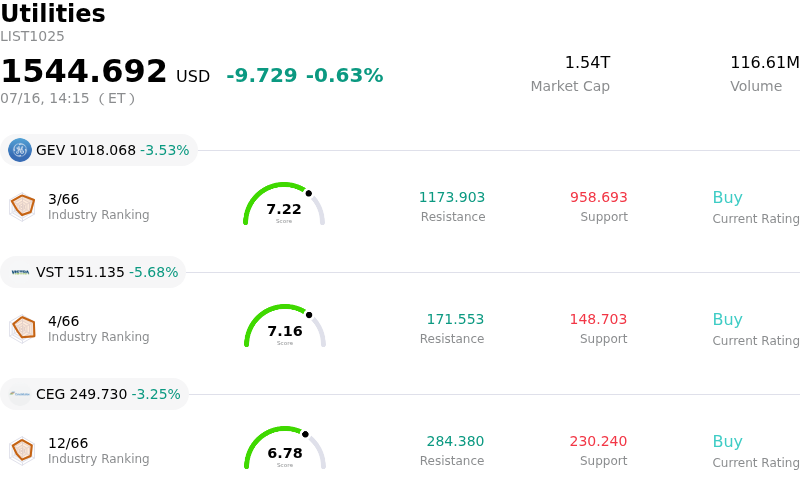
Ge Vernova Inc (GEV) moved down by 3.53%. The Utilities sector is down by 0.63%. The company underperformed the industry. Top 3 stocks by turnover in the sector: Ge Vernova Inc (GEV) down 3.53%; Vistra Corp (VST) down 5.86%; Constellation Energy Corp (CEG) down 3.25%.
What is driving Ge Vernova Inc (GEV)’s stock price down today?
GE Vernova’s downward movement reflects a confluence of sector-specific headwinds and broader macroeconomic pressures currently affecting capital-intensive industrial players. As a leader in the global energy transition, the company remains highly sensitive to shifts in the interest rate environment and fluctuations in government subsidy timelines. Institutional investors appear to be recalibrating their exposure ahead of the upcoming earnings cycle, favoring a more defensive posture as uncertainty grows regarding the execution pace of large-scale grid modernization projects and offshore wind deployments.
One primary catalyst for the current volatility stems from renewed concerns over supply chain stability within the renewable energy segment. Reports indicating potential delays in turbine component deliveries have raised questions about the company’s ability to meet aggressive installation targets for the second half of the year. Because the firm operates on long-term contracts with complex logistics, any perceived disruption in the project execution phase can lead to downward revisions in free cash flow expectations, prompting a swift reaction from momentum-driven traders and algorithmic models.
Furthermore, the broader utility and power generation sector is grappling with evolving regulatory standards that could increase operational costs. Investors are closely monitoring potential shifts in domestic energy policy that might impact the longevity or accessibility of tax credits associated with clean energy initiatives. The possibility of a more restrictive trade environment or a pivot in federal support for electrification has introduced a new risk premium into the stock, contributing to the selling pressure observed during the session.
From a technical perspective, the breach of recent support levels has triggered automated sell orders, which often exacerbates price declines in a high-volatility environment. While the long-term fundamental thesis for electrification and power demand remains supported by the expansion of data centers and industrial automation, the short-term outlook is clouded by these logistical and political hurdles. Institutional portfolio rebalancing, which often occurs mid-month, may have also played a role as fund managers rotate out of high-growth industrial names to lock in year-to-date gains.
Technical Analysis of Ge Vernova Inc (GEV)
Technically, Ge Vernova Inc (GEV) shows a MACD (12,26,9) value of -14.713, indicating a neutral signal. The RSI at 49.577 suggests neutral condition and the Williams %R at 71.879 suggests sell condition. Please monitor closely.
Media Coverage of Ge Vernova Inc (GEV)
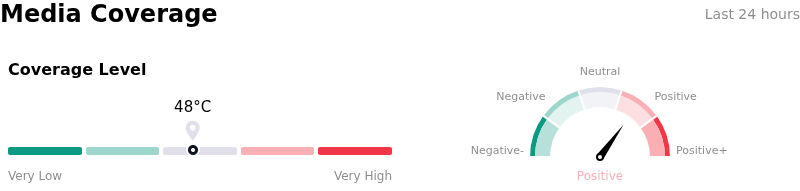
In terms of media coverage, Ge Vernova Inc (GEV) shows a coverage score of 48, indicating a moderate level of media attention. The overall market sentiment index is currently in bullish zone.
Fundamental Analysis of Ge Vernova Inc (GEV)
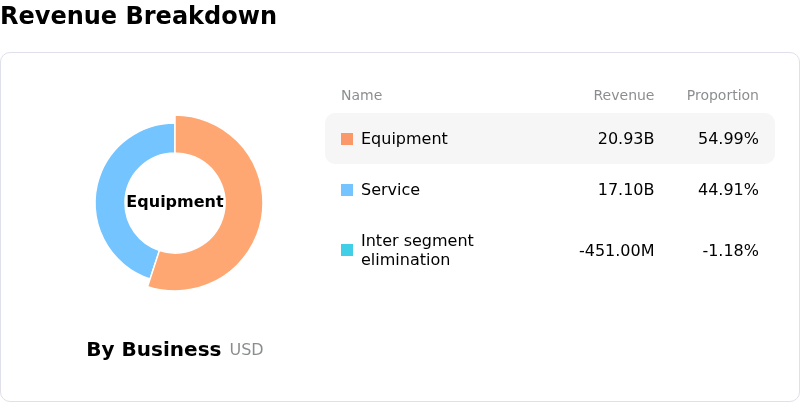
Ge Vernova Inc (GEV) is in the Utilities industry. Its latest annual revenue is $38.07B, ranking 2 in the industry. The net profit is $4.88B, ranking 4 in the industry. Company Profile
Over the past month, multiple analysts have rated the company as Buy, with an average price target of $1205.52, a high of $1424.00, and a low of $836.00.
More details about Ge Vernova Inc (GEV)
Company Specific Risks:
- Blade Failure and Operational Suspension: The recent structural failure of a Haliade-X turbine at the Vineyard Wind 1 project has triggered an immediate suspension of both power production and construction activities, raising critical concerns regarding the mechanical reliability and structural integrity of the company's offshore wind hardware.
- Regulatory and Remediation Liability: GEV faces significant legal and environmental exposure following the dispersal of fiberglass debris across the Massachusetts coastline, likely resulting in federal investigations by the Bureau of Safety and Environmental Enforcement (BSEE) and substantial cleanup costs.
- Contractual Penalties and Margin Compression: The indefinite halt in project execution exposes the company to liquidated damages and higher warranty provisions, further straining the Wind segment's profitability margins which were already under pressure from inflationary costs and supply chain constraints.
- Backlog Execution and Fleet Stability: Institutional analysts have expressed heightened concern that this incident may necessitate a fleet-wide inspection of the Haliade-X platform, potentially delaying the conversion of the company’s multibillion-dollar offshore backlog and damaging its competitive positioning against global peers.
Nothing in this material constitutes investment advice, personal recommendation, investment research, an offer, or a solicitation to buy or sell any financial instrument. The content has been prepared without consideration of your individual investment objectives, financial situation, or needs, and should not be treated as such.
Past performance is not a reliable indicator of future performance and/or results. Forward-looking scenarios or forecasts are not a guarantee of future performance. Actual results may differ materially from those anticipated.
Mitrade makes no representation or warranty as to the accuracy or completeness of the information provided and accepts no liability for any loss arising from reliance on such information.
Recommended Articles


