



Solana (SOLUSD) Is up 1.01% on Jul 26: What Are the Risk Factors?
Solana (SOLUSD) is up 1.01% at Jul 26 00:45(ET), now at $74.19, with a 7-day down of 1.26%.
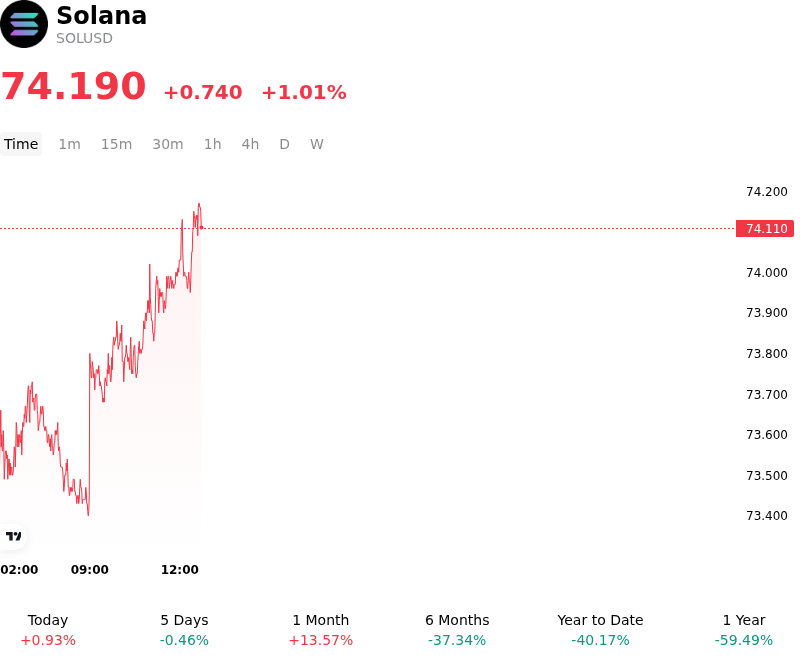
What is driving Solana (SOLUSD)’s stock price up today?
Solana’s price appreciation reflects a confluence of improving macro liquidity and sustained institutional interest in high-performance Layer-1 ecosystems. As global central banks navigate the tail end of tightening cycles, the resulting stabilization in the discount rate has incentivized capital rotation into high-beta digital assets. Solana, positioned as a primary beneficiary of this risk-on sentiment, is seeing renewed inflows as investors seek alternatives to the more mature market caps of Bitcoin and Ethereum.
The intraday volatility observed is largely driven by a significant uptick in on-chain activity and institutional allocation strategies. The expansion of decentralized finance applications and the integration of Solana-based payment rails by major financial intermediaries have bolstered the asset's utility narrative. Furthermore, the market is reacting to shifts in the regulatory landscape that favor assets with demonstrated decentralized governance and high network utility. This has encouraged long-term positioning by hedge funds and asset managers who view Solana as a critical infrastructure layer for the future of digital finance.
Liquidity conditions in the derivatives market have also played a pivotal role. The moderate advance occurred alongside a compression in funding rates, suggesting that the move was supported by spot buying rather than purely leveraged speculation. However, the accompanying volatility indicates that the market is clearing out short-term speculative positions near key technical resistance levels. This churn is typical of a healthy consolidation phase where weak hands are replaced by institutional holders with a longer time horizon.
From a structural perspective, the growth in stablecoin circulation on the Solana network serves as a leading indicator of increased capital efficiency. As more liquidity enters the ecosystem, the velocity of SOL increases, creating a feedback loop that supports higher valuation floors. The resilience of the network during periods of high traffic continues to mitigate historical concerns regarding uptime, further cementing investor confidence in Solana’s technological roadmap.
While macro risks regarding Treasury yields and potential shifts in Federal Reserve rhetoric remain, the current price action suggests that idiosyncratic growth drivers within the Solana ecosystem are beginning to decouple from broader market volatility. The concentration of developer talent and the acceleration of enterprise-grade pilot programs on the network provide a fundamental anchor that justifies the current capital inflows. Investors are increasingly viewing Solana not just as a speculative vehicle, but as a core component of a diversified digital asset portfolio.
Technical Analysis of Solana (SOLUSD)
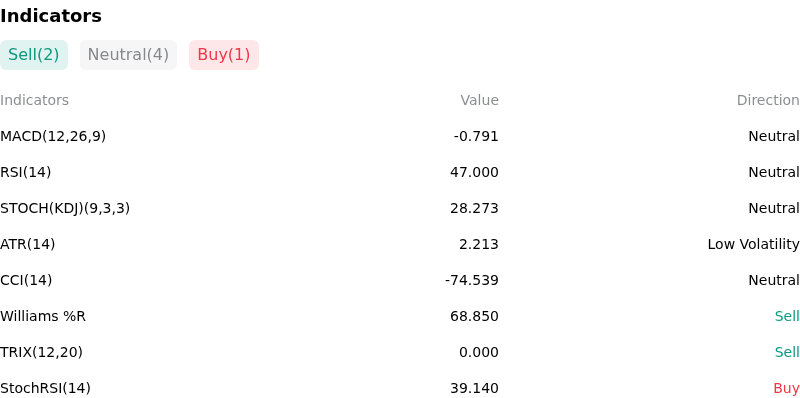
Technically, Solana (SOLUSD) shows a MACD (12,26,9) value of -0.791, indicating a neutral signal. The RSI at 47.000 suggests neutral condition and the Williams %R at 68.850 suggests sell condition. Please monitor closely.
More details about Solana (SOLUSD)
p>Recent Events and Risks:
- ETF Approval Uncertainty and Regulatory Headwinds: While recent filings for Solana-based spot ETFs have generated speculative interest, institutional analysts note that the SEC’s ongoing classification of SOL as a security in litigation against major exchanges creates a high probability of rejection or prolonged delays, posing a "buy the rumor, sell the news" risk if regulatory progress stalls.
- Leverage Concentration and Liquidation Risk: Market data indicates a significant buildup of long-biased Open Interest in SOL perpetual futures; this concentration increases the susceptibility to a liquidation cascade, where a minor price drop could trigger automated selling, causing deeper intraday volatility compared to lower-beta assets.
- Institutional Supply Overhang: Continued monitoring of wallets associated with the FTX/Alameda estate reveals ongoing concerns regarding the liquidation of their substantial SOL holdings; any perceived movement of these assets toward centralized exchanges creates immediate sell-side pressure and discourages large-scale liquidity providers from maintaining tight spreads.
- Network Congestion and Ecosystem Sensitivity: Solana’s reliance on high-frequency meme coin trading for transaction volume exposes the asset to downside risks if speculative activity cools; furthermore, any resurgence of network instability or elevated transaction failure rates during high-traffic periods remains a persistent operational risk that can trigger rapid capital outflows.
Nothing in this material constitutes investment advice, personal recommendation, investment research, an offer, or a solicitation to buy or sell any financial instrument. The content has been prepared without consideration of your individual investment objectives, financial situation, or needs, and should not be treated as such.
Past performance is not a reliable indicator of future performance and/or results. Forward-looking scenarios or forecasts are not a guarantee of future performance. Actual results may differ materially from those anticipated.
Mitrade makes no representation or warranty as to the accuracy or completeness of the information provided and accepts no liability for any loss arising from reliance on such information.
Recommended Articles


