



Interactive Brokers Group Inc Stock (IBKR) Closed Up by 3.10% on Aug 10: What Investors Need To Know
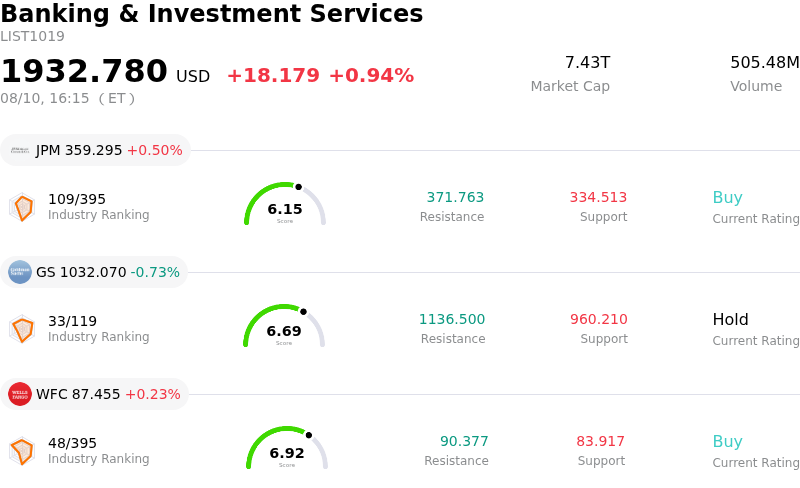
Interactive Brokers Group Inc (IBKR) closed up by 3.10%. The Banking & Investment Services sector is up by 0.94%. The company outperformed the industry. Top 3 stocks by turnover in the sector: JPMorgan Chase & Co (JPM) up 0.50%; Goldman Sachs Group Inc (GS) down 0.73%; Wells Fargo & Co (WFC) up 0.23%.
What is driving Interactive Brokers Group Inc (IBKR)’s stock price up today?
Interactive Brokers has demonstrated notable strength during the current trading session, fueled primarily by a shift in market expectations regarding the interest rate environment and superior operating metrics. As a company highly sensitive to net interest income, any signal from the Federal Reserve that suggests a stabilization of higher-for-longer rates provides a direct tailwind to the firm's margin profile. Investors are increasingly pricing in the sustained profitability of the company's cash management and margin lending segments, which remain core drivers of its bottom-line performance.
The observed intraday volatility appears linked to the recent release of institutional trading data, which indicates a robust uptick in daily average revenue trades across global markets. Interactive Brokers continues to capture market share from traditional wirehouses and smaller discount brokers by leveraging its low-cost structure and superior execution technology. The growth in client equity, particularly within the hedge fund and professional trader segments, underscores the firm's resilience despite broader macroeconomic uncertainties. This influx of capital suggests that sophisticated investors are positioning themselves for increased market activity, directly benefiting the firm's transaction-based revenue streams.
From an institutional perspective, the upward trajectory is further supported by a rotation into high-quality financial services stocks that offer a hedge against currency fluctuations and global market volatility. As international trading volumes rise, the company's multi-currency capabilities provide a unique competitive advantage that is currently being rewarded by the market. Furthermore, analyst sentiment has remained overwhelmingly positive, with several firms recently revising their earnings per share guidance upward based on the company's ability to maintain a lean operating expense ratio while scaling its global footprint.
Despite the positive momentum, the significant intraday price swings reflect a degree of uncertainty regarding upcoming inflation data and its potential impact on trading volumes. Institutional portfolio adjustments ahead of mid-quarter rebalancing may also be contributing to the heightened activity. However, the underlying fundamental strength of the business, characterized by high operating margins and a robust balance sheet, suggests that the current move is rooted in a fundamental reappraisal of the company's long-term earnings power rather than speculative retail activity.
Technical Analysis of Interactive Brokers Group Inc (IBKR)
Technically, Interactive Brokers Group Inc (IBKR) shows a MACD (12,26,9) value of -1.178, indicating a sell signal. The RSI at 45.070 suggests neutral condition and the Williams %R at 75.835 suggests sell condition. Please monitor closely.
Media Coverage of Interactive Brokers Group Inc (IBKR)
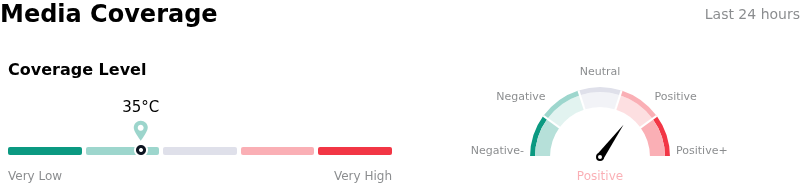
In terms of media coverage, Interactive Brokers Group Inc (IBKR) shows a coverage score of 35, indicating a low level of media attention. The overall market sentiment index is currently in bullish zone.
Fundamental Analysis of Interactive Brokers Group Inc (IBKR)
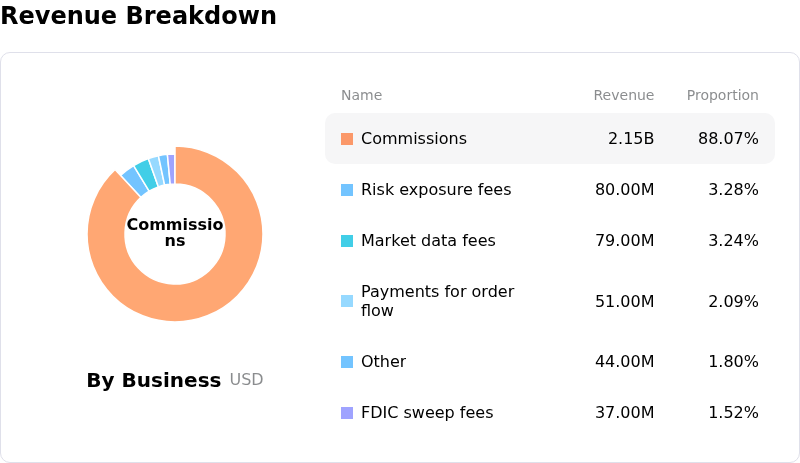
Interactive Brokers Group Inc (IBKR) is in the Banking & Investment Services industry. Its latest annual revenue is $10.00B, ranking 24 in the industry. The net profit is $984.00M, ranking 24 in the industry. Company Profile
Over the past month, multiple analysts have rated the company as Buy, with an average price target of $106.31, a high of $121.00, and a low of $72.18.
More details about Interactive Brokers Group Inc (IBKR)
Company Specific Risks:
- Net Interest Margin Compression: The firm faces significant downside pressure from the Federal Reserve's recent shift toward a rate-cutting cycle, which directly reduces the yield on Interactive Brokers' massive client cash balances and margin loan book, a primary driver of its recent earnings growth.
- Margin Loan Deleveraging: Current market volatility has triggered a trend of risk-aversion among professional and institutional traders, leading to a contraction in margin loan balances that threatens to reduce interest-earning assets and top-line revenue.
- Operational Risk in Automated Liquidation: During periods of extreme intraday price gaps, the company’s signature real-time automated liquidation system faces the risk of execution slippage, potentially leaving the firm exposed to unsecured client deficits if collateral values drop faster than positions can be closed.
- Increased Regulatory Compliance Spend: Recent commentary from institutional analysts highlights concerns regarding rising non-interest expenses as the company scales its international operations, requiring heavier investment in global anti-money laundering (AML) and multi-jurisdictional tax compliance frameworks.
Nothing in this material constitutes investment advice, personal recommendation, investment research, an offer, or a solicitation to buy or sell any financial instrument. The content has been prepared without consideration of your individual investment objectives, financial situation, or needs, and should not be treated as such.
Past performance is not a reliable indicator of future performance and/or results. Forward-looking scenarios or forecasts are not a guarantee of future performance. Actual results may differ materially from those anticipated.
Mitrade makes no representation or warranty as to the accuracy or completeness of the information provided and accepts no liability for any loss arising from reliance on such information.
Recommended Articles


