



Applied Materials Inc Stock (AMAT) Opened Down by 3.02% on Aug 24: What Investors Need To Know
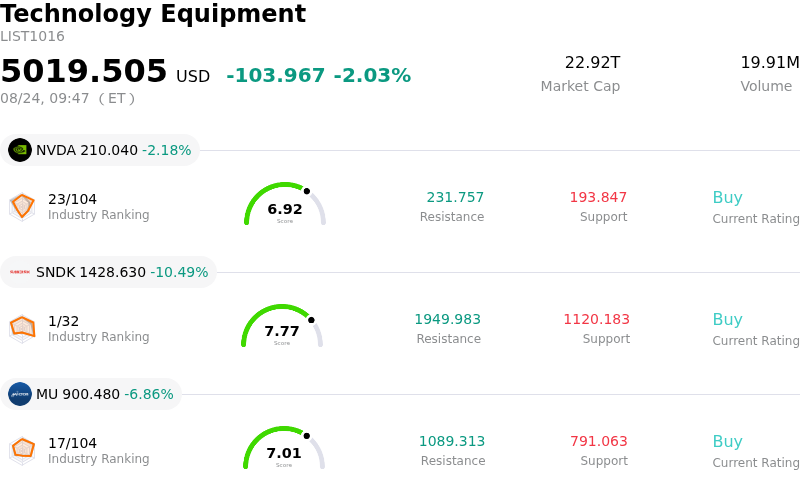
Applied Materials Inc (AMAT) opened down by 3.02%. The Technology Equipment sector is down by 2.03%. The company underperformed the industry. Top 3 stocks by turnover in the sector: NVIDIA Corp (NVDA) down 2.42%; SanDisk Corporation (SNDK) down 10.91%; Micron Technology Inc (MU) down 6.86%.
What is driving Applied Materials Inc (AMAT)’s stock price down today?
Applied Materials experienced downward price momentum and notable intraday volatility as the market continued to digest its recent fiscal third-quarter earnings report. Although the company delivered record top-line and bottom-line results alongside strong forward revenue guidance driven by robust artificial intelligence infrastructure demand, investor expectations had been set exceptionally high. The recent price action reflects a broader valuation recalibration where elevated multiples prior to the earnings release left limited room for upside surprises, triggering sustained profit-taking across tech portfolios.
A central driver of the ongoing sell-off stems from operational margin considerations and aggressive capital expenditure plans. Management highlighted substantial capacity expansions to support multi-year growth in advanced packaging, DRAM, and high-bandwidth memory equipment. However, the substantial personnel additions and ramp-up costs associated with scaling global systems manufacturing capacity have generated near-term margin headwinds. While institutional analysts largely reaffirmed positive long-term outlooks, market participants remain cautious regarding the near-term margin trajectory and the timeline required for new capacity to yield full operating leverage.
Broader semiconductor sector trends and macroeconomic factors have further amplified intraday price swings. Chip equipment stocks have faced industry-wide profit-taking as investors re-evaluate technology hardware valuations in light of broader macroeconomic conditions and fluctuating Treasury yields. Additionally, recent institutional portfolio adjustments and insider filings have contributed to cautious trading sentiment. Consequently, the stock remains caught in a transitional phase where strong long-term fundamental demand in artificial intelligence manufacturing is temporarily counterbalanced by short-term valuation constraints and macro sector rotation.
Technical Analysis of Applied Materials Inc (AMAT)
Technically, Applied Materials Inc (AMAT) shows a MACD (12,26,9) value of -6.643, indicating a sell signal. The RSI at 40.879 suggests neutral condition and the Williams %R at 95.849 suggests oversold condition. Please monitor closely.
Media Coverage of Applied Materials Inc (AMAT)
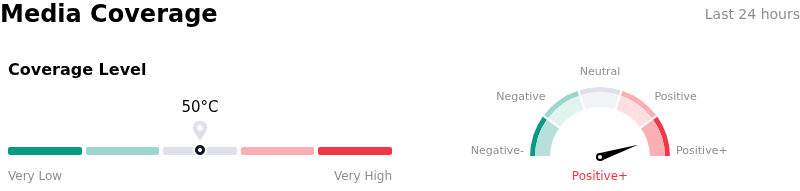
In terms of media coverage, Applied Materials Inc (AMAT) shows a coverage score of 50, indicating a moderate level of media attention. The overall market sentiment index is currently in extremely bullish zone.
Fundamental Analysis of Applied Materials Inc (AMAT)
Applied Materials Inc (AMAT) is in the Technology Equipment industry. Its latest annual revenue is $28.37B, ranking 11 in the industry. The net profit is $7.00B, ranking 8 in the industry. Company Profile
Over the past month, multiple analysts have rated the company as Buy, with an average price target of $635.01, a high of $900.00, and a low of $308.00.
More details about Applied Materials Inc (AMAT)
Company Specific Risks:
- Sequential Margin Stagnation and Capex Cost Drag: Despite record quarterly revenues, non-GAAP gross margin guidance for Q4 FY2026 was projected flat at 50.4% sequentially. Heavy upfront capital expenditures required to double systems manufacturing capacity by 2028 and expand R&D initiatives (such as the EPIC Center buildout) are compressing near-term operating leverage.
- Lack of Long-Term Systems Revenue Visibility: Management withheld explicit numerical growth guidance for its core Semiconductor Systems division for 2027. Institutional analysts highlighted that this absence of long-term visibility creates execution uncertainty over whether the company can maintain relative outperformance against key equipment rivals like Lam Research, KLA, and ASML.
- Geopolitical Trade Exposure and Regional Revenue Misses: Revenue from China dropped 1.6% year-over-year in absolute terms to 28% of total sales amid ongoing export restriction headwinds, while Q3 sales in South Korea ($1.52 billion) lagged analyst consensus estimates by 26.5%. Recent disclosures also recorded a $253 million charge related to an export controls compliance settlement.
- Institutional Stake Reductions and Bearish Positioning: Recent SEC filings revealed significant institutional de-risking, including Deutsche Bank trimming its position by 38.4%, alongside high-profile hedge fund liquidations and increased short/put exposure. This institutional selling pressure continues to exacerbate post-earnings intraday volatility.
Nothing in this material constitutes investment advice, personal recommendation, investment research, an offer, or a solicitation to buy or sell any financial instrument. The content has been prepared without consideration of your individual investment objectives, financial situation, or needs, and should not be treated as such.
Past performance is not a reliable indicator of future performance and/or results. Forward-looking scenarios or forecasts are not a guarantee of future performance. Actual results may differ materially from those anticipated.
Mitrade makes no representation or warranty as to the accuracy or completeness of the information provided and accepts no liability for any loss arising from reliance on such information.
Recommended Articles


