



Solana Price Forecast: SOL eyes $100 breakout amid governance voting, renewed ETF inflows
- Solana edges lower on Monday, holding above $90 after a 27% rise the previous week.
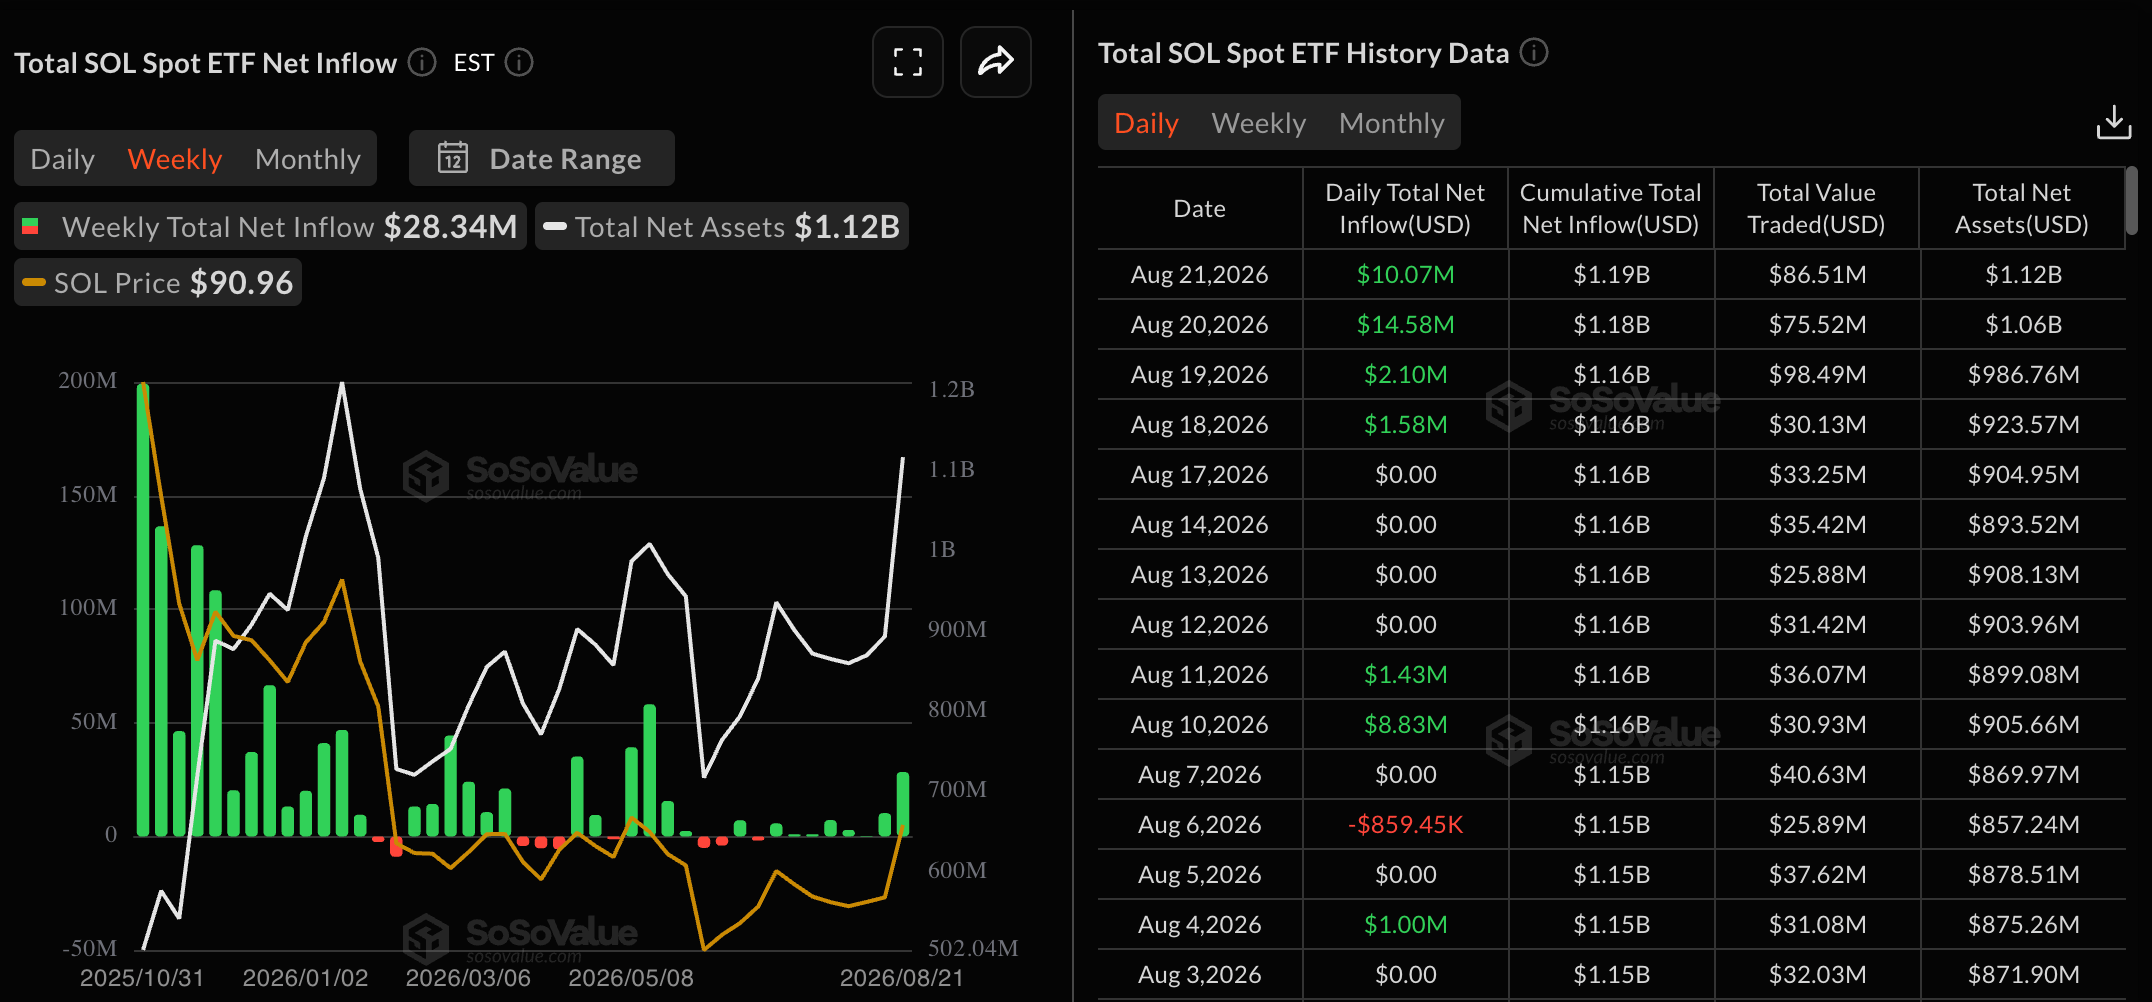
- SOL-focused ETFs recorded $28.34 million in inflows last week, the highest since mid-May, indicating renewed institutional demand.
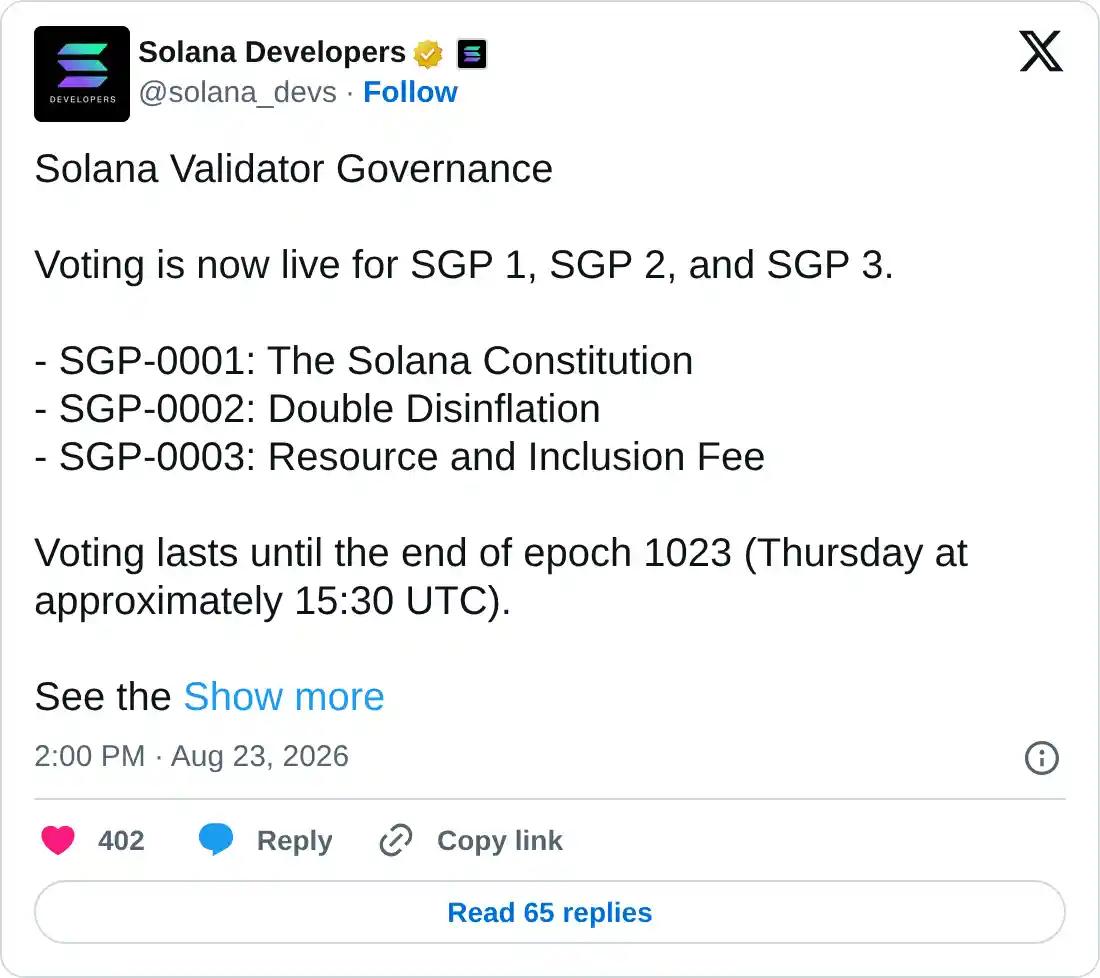
- Solana validator governance has started voting on SGP 1, SGP 2, and SGP 3, which include doubling the disinflation rate to -30%.
Solana (SOL) edges lower to $94 on Monday, following a 27% rebound last week to a two-month high. SOL-focused Exchange Traded Funds (ETFs) recorded four consecutive days of inflows last week, totaling $28.34 million, suggesting renewed institutional buying. Validator voting on multiple proposals started on Monday, which includes doubling the disinflation rate to 30%.
Solana validator voting begins
Solana validators have begun voting on SGP 1, SGP 2, and SGP 3 proposals, with voting ending Thursday. The SGP 1 protocol addresses the ratification of the Solana Constitution to govern Solana’s network-level decision-making. SGP 2 proposes reducing the inflation rate by increasing the disinflation rate to -15% to -30%. Finally, SGP 3 plans to introduce a fixed base inclusion fee paid to the block leader and a resource fee with a requested transaction cost, which will be burned.
Taken together, the proposals will restructure on-chain decision-making and reduce pressure on available supply.
Solana ETFs regain strength
Solana regains institutional demand. SoSoValue data shows the SOL-focused ETFs recorded $28.34 million in inflows last week, the highest over the last two months. Typically, renewed buying from institutional investors implies a bullish trend reversal.
Technical outlook: Will SOL price cross above $100?
Solana trades around $94 on Monday, holding a bullish near-term bias above both the 50-day Exponential Moving Average (EMA) at $79.04 and the 200-day EMA at $92.67. SOL price remains capped below the $100 psychological level and the May 11 high of $98.41.
For a sustained recovery, SOL should confirm a decisive close above the $100 mark. This could open the path toward the 127.2% Fibonacci extension level of the $98.41 to $60.13 downswing at $112.52.
Momentum stays strong, with the Relative Strength Index (RSI) hovering in overbought territory near 79 on the daily chart. At the same time, the Moving Average Convergence Divergence (MACD) shows a steady upward trend with a positive histogram, suggesting that buying pressure remains dominant.
On the downside, initial support is seen at the 200-day EMA around $92.67, followed by the 78.6% retracement near $88.56. Deeper declines would expose the 50-day EMA at $79.04 and the 50% retracement at $76.92.
(The technical analysis of this story was written with the help of an AI tool. Know more.)
Nothing in this material constitutes investment advice, personal recommendation, investment research, an offer, or a solicitation to buy or sell any financial instrument. The content has been prepared without consideration of your individual investment objectives, financial situation, or needs, and should not be treated as such.
Past performance is not a reliable indicator of future performance and/or results. Forward-looking scenarios or forecasts are not a guarantee of future performance. Actual results may differ materially from those anticipated.
Mitrade makes no representation or warranty as to the accuracy or completeness of the information provided and accepts no liability for any loss arising from reliance on such information.
Recommended Articles


