



Oracle Corp Stock (ORCL) Moved Down by 3.16% on Aug 24: What Signal Does It Send?
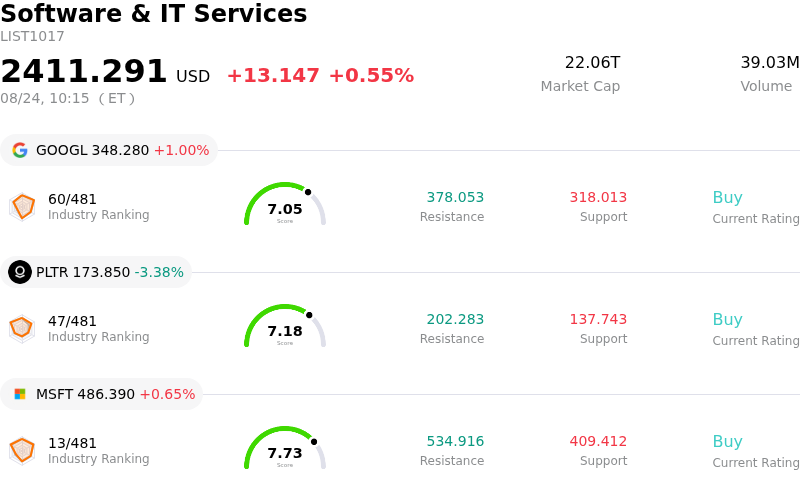
Oracle Corp (ORCL) moved down by 3.16%. The Software & IT Services sector is up by 0.55%. The company underperformed the industry. Top 3 stocks by turnover in the sector: Alphabet Inc Class A (GOOGL) up 1.00%; Palantir Technologies Inc (PLTR) down 3.41%; Microsoft Corp (MSFT) up 0.65%.
What is driving Oracle Corp (ORCL)’s stock price down today?
Oracle Corporation experienced downward pressure and heightened intraday volatility as market participants re-evaluated the company's aggressive capital expenditures against its near-term cash generation profile. While enterprise demand for cloud infrastructure and artificial intelligence workloads remains robust—underpinned by a massive multi-year remaining performance obligation backlog—investor focus has increasingly shifted toward the financial drag caused by expanding data center buildouts. Substantial capital spending has severely strained free cash flow, and management's reliance on significant debt and equity financing to fund ongoing infrastructure expansion has raised concerns over balance sheet leverage, credit rating pressures, and potential equity dilution.
Operational execution risks have further exacerbated selling pressure. Recent delays surrounding critical utility infrastructure for major data center projects have raised fears that revenue conversion from the company's backlog could face near-term bottlenecks. Furthermore, broader market debate regarding the return on investment for hyperscaler capital expenditures, alongside warnings from prominent macro investors about leverage risks across the technology supply chain, has kept buyers cautious. These concerns contributed to technical weakness as shares traded below key short-term and medium-term moving averages, triggering automated selling and intraday volatility.
To balance escalating capital commitments with profitability expectations, market reports suggest the company is considering targeted cost-reduction initiatives, including potential headcount adjustments across select divisions. Although institutional positioning remains supported by long-term cloud integration partnerships with major hyperscale providers, the near-term risk-reward profile is being reassessed. Until management provides clearer visibility into capital efficiency, funding costs, and a path toward positive cash flow inflection, the stock remains sensitive to macroeconomic sentiment and sector-wide risk off trading.
Technical Analysis of Oracle Corp (ORCL)
Technically, Oracle Corp (ORCL) shows a MACD (12,26,9) value of 0.913, indicating a buy signal. The RSI at 48.986 suggests neutral condition and the Williams %R at 77.554 suggests sell condition. Please monitor closely.
Media Coverage of Oracle Corp (ORCL)
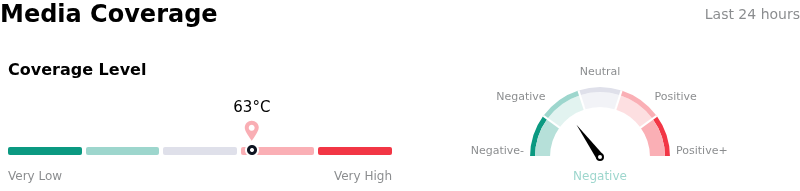
In terms of media coverage, Oracle Corp (ORCL) shows a coverage score of 63, indicating a high level of media attention. The overall market sentiment index is currently in bearish zone.
Fundamental Analysis of Oracle Corp (ORCL)
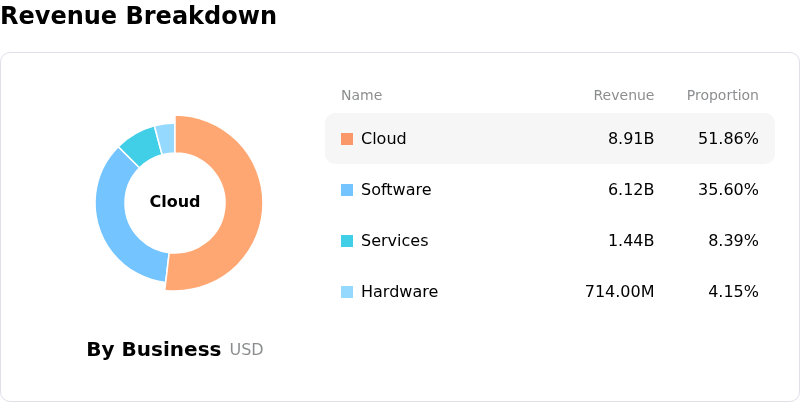
Oracle Corp (ORCL) is in the Software & IT Services industry. Its latest annual revenue is $67.36B, ranking 8 in the industry. The net profit is $16.98B, ranking 6 in the industry. Company Profile
Over the past month, multiple analysts have rated the company as Buy, with an average price target of $252.87, a high of $400.00, and a low of $110.00.
More details about Oracle Corp (ORCL)
Company Specific Risks:
- Credit Downgrade and Expanding Debt Load: S&P Global Ratings downgraded Oracle's credit rating to BBB- as credit analysts scrutinize long-term debt surpassing $122 billion and leverage metrics approaching 5x EBITDA to support debt-funded AI infrastructure expansion.
- Severe Free Cash Flow Deficits Driven by AI Capex: Massive capital expenditures exceeding $55 billion for AI data centers have pushed free cash flow into deep negative territory (-$23.7 billion), sparking institutional anxiety over liquidity needs and potential capital raises.
- Gross Margin Compression from Soaring Infrastructure Costs: Aggressive buildouts of high-performance computing clusters and data center leases caused gross margins to contract to 65.8%, as cost of sales jumped to $23 billion and weighed heavily on profitability.
- Customer Concentration and Backlog Conversion Execution Risks: Analysts express concern over high customer concentration among major AI clients like OpenAI, along with execution delays in deploying gigawatt-scale data center capacity necessary to convert its $638 billion backlog into realized revenue.
Nothing in this material constitutes investment advice, personal recommendation, investment research, an offer, or a solicitation to buy or sell any financial instrument. The content has been prepared without consideration of your individual investment objectives, financial situation, or needs, and should not be treated as such.
Past performance is not a reliable indicator of future performance and/or results. Forward-looking scenarios or forecasts are not a guarantee of future performance. Actual results may differ materially from those anticipated.
Mitrade makes no representation or warranty as to the accuracy or completeness of the information provided and accepts no liability for any loss arising from reliance on such information.
Recommended Articles


