



VNET Group Inc Stock (VNET) Moved Up by 7.03% on Aug 25: A Full Analysis
VNET Group Inc (VNET) moved up by 7.03%. The Software & IT Services sector is up by 0.21%. The company outperformed the industry. Top 3 stocks by turnover in the sector: Microsoft Corp (MSFT) down 0.00%; Meta Platforms Inc (META) up 0.89%; Alphabet Inc Class A (GOOGL) up 0.11%.
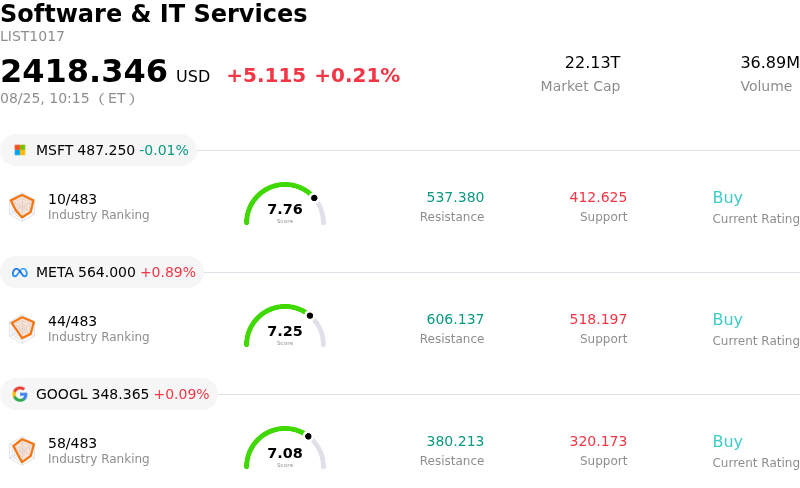
What is driving VNET Group Inc (VNET)’s stock price up today?
VNET Group experienced significant upward momentum with heightened intraday volatility as investors re-evaluated the company's strong operational performance and expanding role in China's artificial intelligence infrastructure landscape. Renewed buying interest was primarily driven by market appreciation of VNET's wholesale Internet Data Center business, which continues to benefit from surging demand for high-performance computing and AI workload capacity. The company's recent operational updates highlighted substantial new order wins, notably secured from major cloud service providers, cementing visibility into revenue growth over the coming quarters.
Strategic initiatives have further bolstered investor confidence. VNET recently achieved a key milestone by crossing one gigawatt in wholesale capacity in service, accompanied by a growing total capacity pipeline across mainland China and international markets. Additionally, the strategic partnership announced with battery giant Contemporary Amperex Technology Co. Limited to co-develop a three-layer integrated compute-energy ecosystem has resonated positively with institutional investors focused on energy efficiency, green compute solutions, and long-term cost optimization.
On the financial front, market sentiment was supported by the company's second-quarter earnings report, which showcased solid double-digit top-line growth and a turnaround to positive adjusted net income. Driven by higher-margin wholesale expansion, non-GAAP adjusted EBITDA margin expanded year-over-year, leading management to reiterate full-year revenue and profitability targets. While GAAP net losses and elevated capital expenditure requirements previously triggered short-term pullbacks, trading action reflects a pivot back to growth drivers as valuation multiples attract buyers.
Despite intraday fluctuations stemming from market debate over leverage ratios and capital spending commitments, the underlying trend turned decisively positive. Momentum traders and institutional investors capitalized on recent price consolidation, absorbing selling pressure and pushing the stock higher. Going forward, execution against planned capacity deliveries, debt refinancing management, and customer move-in velocity will remain critical catalysts for sustained share price performance.
Technical Analysis of VNET Group Inc (VNET)
Technically, VNET Group Inc (VNET) shows a MACD (12,26,9) value of -0.060, indicating a sell signal. The RSI at 45.146 suggests neutral condition and the Williams %R at 66.250 suggests sell condition. Please monitor closely.
Fundamental Analysis of VNET Group Inc (VNET)
VNET Group Inc (VNET) is in the Software & IT Services industry. Its latest annual revenue is $1.44B, ranking 153 in the industry. The net profit is $-37.24M, ranking 476 in the industry. Company Profile
Over the past month, multiple analysts have rated the company as Buy, with an average price target of $14.24, a high of $25.04, and a low of $11.00.
More details about VNET Group Inc (VNET)
Company Specific Risks:
- Widening Quarterly Losses and Earnings Miss: VNET reported a sharply expanded net loss attributable to the company of RMB 135.6 million for Q2 2026, up from RMB 11.9 million in the prior-year period, driven primarily by an RMB 47.1 million loss from changes in the fair value of financial instruments and higher operational expenses.
- Severe Balance Sheet Leverage and Refinancing Exposure: The company holds RMB 23.42 billion in total debt against negative working capital of approximately RMB 2.52 billion, with over 40% of its debt stack scheduled to mature between 2026 and 2028, escalating borrowing costs and refinancing risks.
- Heavy Capital Expenditures and Cash Burn: VNET reiterated an aggressive 2026 capital expenditure budget of RMB 10 billion to RMB 12 billion to fund wholesale AI data center capacity, heightening free cash flow drag, elevating depreciation expense, and straining immediate liquidity.
- Unrevised Revenue Guidance and Customer Concentration: Management failed to raise full-year 2026 revenue guidance despite reporting strong wholesale demand, disappointing analyst expectations and highlighting revenue vulnerability due to heavy reliance on a small cluster of major hyperscale clients.
Nothing in this material constitutes investment advice, personal recommendation, investment research, an offer, or a solicitation to buy or sell any financial instrument. The content has been prepared without consideration of your individual investment objectives, financial situation, or needs, and should not be treated as such.
Past performance is not a reliable indicator of future performance and/or results. Forward-looking scenarios or forecasts are not a guarantee of future performance. Actual results may differ materially from those anticipated.
Mitrade makes no representation or warranty as to the accuracy or completeness of the information provided and accepts no liability for any loss arising from reliance on such information.
Recommended Articles


