



BNB (BNBUSD) Fluctuated Significantly on Sep 2: Key Variables Behind the Move
BNB (BNBUSD) is up 1.00% at Sep 2 01:00(ET), now at $685.8, with a 7-day down of 1.61%.
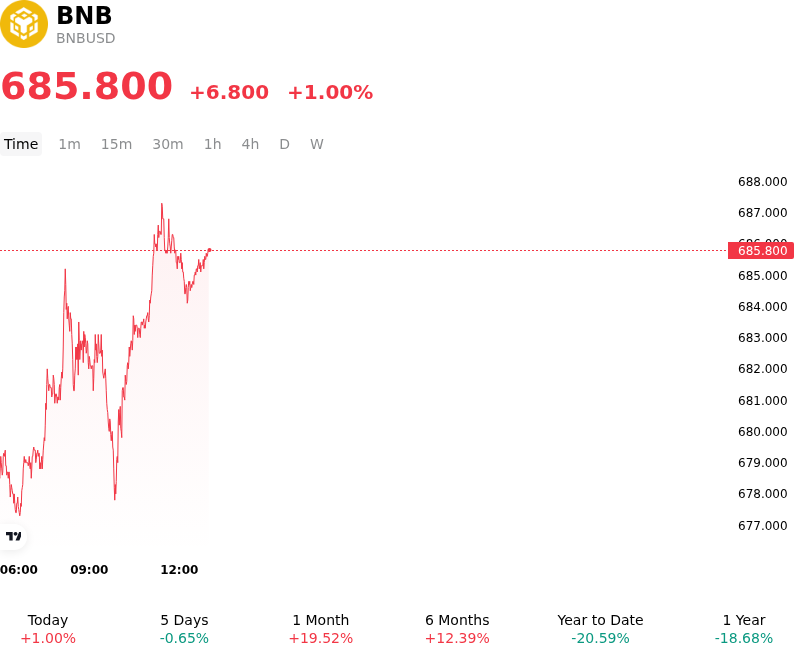
What is driving BNB (BNBUSD)’s stock price up today?
The upward price action in BNBUSD reflects a combination of stabilizing broad-market liquidity conditions and growing investor demand for high-throughput Layer-1 networks following fundamental infrastructure upgrades. As macroeconomic uncertainty surrounding upcoming central bank interest rate decisions begins to settle, capital has selectively rotated back into top-tier smart-contract ecosystems displaying resilient user metrics. The broader digital asset market continues to absorb steady capital flows into large-cap assets, reinforcing baseline risk appetite across major token benchmarks.
Network-specific enhancements have played a pivotal role in strengthening ecosystem sentiment. The activation of the Pasteur hard fork on the BNB Smart Chain expanded network throughput and tightened validator security protocols, significantly enhancing transaction processing capabilities. In parallel, ecosystem initiatives such as the extension of zero-fee promotional campaigns for stablecoin transfers and cross-chain bridging throughout September have effectively reduced transaction friction. These measures have catalyzed active on-chain liquidity, driving sustained volume across decentralized exchanges and encouraging capital retention within the network.
From a derivatives and market structure perspective, BNB continues to benefit from balanced positioning, with open interest stabilizing near key technical support levels. Stable funding rates and orderly leverage profiles indicate that the advance was led by spot-driven accumulation rather than speculative over-leveraging. While institutional participants maintain a watchful eye on broader macroeconomic data releases and regulatory votes scheduled for later in the month, BNB's underlying network throughput gains, robust stablecoin circulation, and essential utility within its ecosystem continue to anchor long-term investor confidence.
Technical Analysis of BNB (BNBUSD)
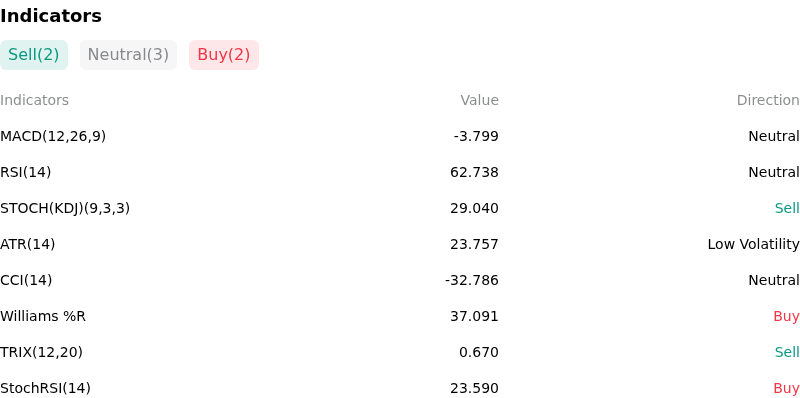
Technically, BNB (BNBUSD) shows a MACD (12,26,9) value of -3.799, indicating a neutral signal. The RSI at 62.738 suggests neutral condition and the Williams %R at 37.091 suggests buy condition. Please monitor closely.
More details about BNB (BNBUSD)
Recent Events and Risks:
- Technical Rejection and Macro Risk-Off Sentiment: BNB experienced a rejection at the $700–$725 resistance level, slipping below $689 amid broader crypto risk-off sentiment triggered by hawkish macroeconomic commentary and upcoming U.S. economic reports, leaving the token vulnerable to retesting lower support near $648.
- Asymmetric Long Liquidation Exposure: On-chain leverage heatmaps highlight a heavy concentration of roughly $80 million in long liquidation liquidity stacked immediately below spot prices between $702 and $683. Losing current support levels creates a heightened risk of a cascading automated sell-off into lower liquidity pockets.
- Centralized Protocol Risk and Regulatory Friction: BNB's valuation remains heavily coupled to Binance's operational footprint, where ongoing global regulatory scrutiny—including European Markets in Crypto-Assets (MiCA) compliance hurdles and licensing uncertainty—continues to limit institutional adoption and cap risk appetite.
- Large-Cap Capital Drag and Liquidity Rotations: With a market capitalization exceeding $90 billion, analysts note that driving further upside requires sustained institutional capital flow, prompting speculative capital and short-term liquidity to rotate into higher-beta assets and emerging cross-chain protocols.
Nothing in this material constitutes investment advice, personal recommendation, investment research, an offer, or a solicitation to buy or sell any financial instrument. The content has been prepared without consideration of your individual investment objectives, financial situation, or needs, and should not be treated as such.
Past performance is not a reliable indicator of future performance and/or results. Forward-looking scenarios or forecasts are not a guarantee of future performance. Actual results may differ materially from those anticipated.
Mitrade makes no representation or warranty as to the accuracy or completeness of the information provided and accepts no liability for any loss arising from reliance on such information.
Recommended Articles


