



Shiba Inu Price Forecast: Faces downside risks as whale selling rises
- Shiba Inu steadies at $0.00000516 on Wednesday, after recovering nearly 4% in the previous two days.
- Santiment data shows that certain whale wallets are offloading SHIB tokens, raising concerns.
- Derivatives and on-chain data show cautious signs with rising short bets alongside signs of overheated market conditions.
Shiba Inu (SHIB) trades around $0.00000516 on Wednesday following a rebound of nearly 4% earlier this week. Despite the price recovery, Santiment data shows certain whales offloading SHIB tokens. Meanwhile, weakening derivatives and on-chain data for the meme coin suggest a cautious tone, which could increase the downside risk.
Whales are selling SHIB
Santiment’s Supply Distribution data supports a bearish outlook for Shiba Inu, as large-wallet holders (whales) are reducing exposure after the meme coin’s recent price surge.
The metric indicates that whales holding between 1 million and 10 million (yellow line) and 10 million and 100 million tokens (blue line) have shed 40 billion tokens since August 22.
In the same period, whales holding between 100,000 and 1 million (red line) have accumulated 990 million SHIB. This indicates a shift in positioning among large holders: top-tier whales and mid-sized whales are reducing exposure, signaling potential profit-booking, while small whales are absorbing some supply, often reflecting distribution and adding near-term downside risk for the meme coin.
 [09-1788326159240.25.14, 02 Sep, 2026].png)
Derivatives and on-chain data show weakening signs
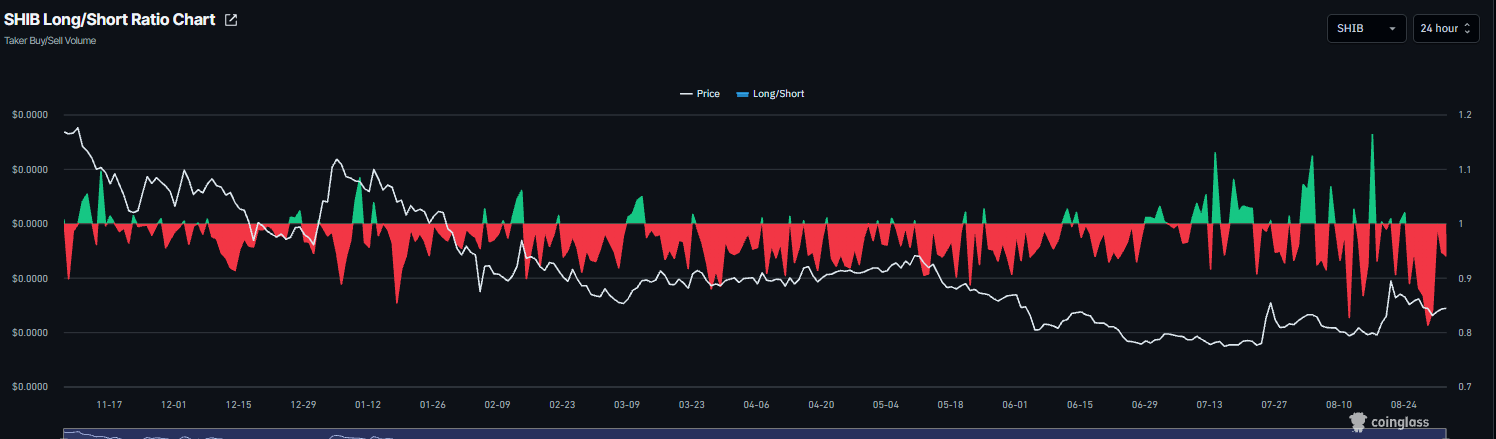
SHIB derivatives metrics and on-chain outlook show a cautious tone. CoinGlass’ long-to-short ratio for the dog-themed meme coin read 0.93 on Wednesday. The ratio being below one, indicates bearish sentiment, as traders are betting the asset’s price will fall.
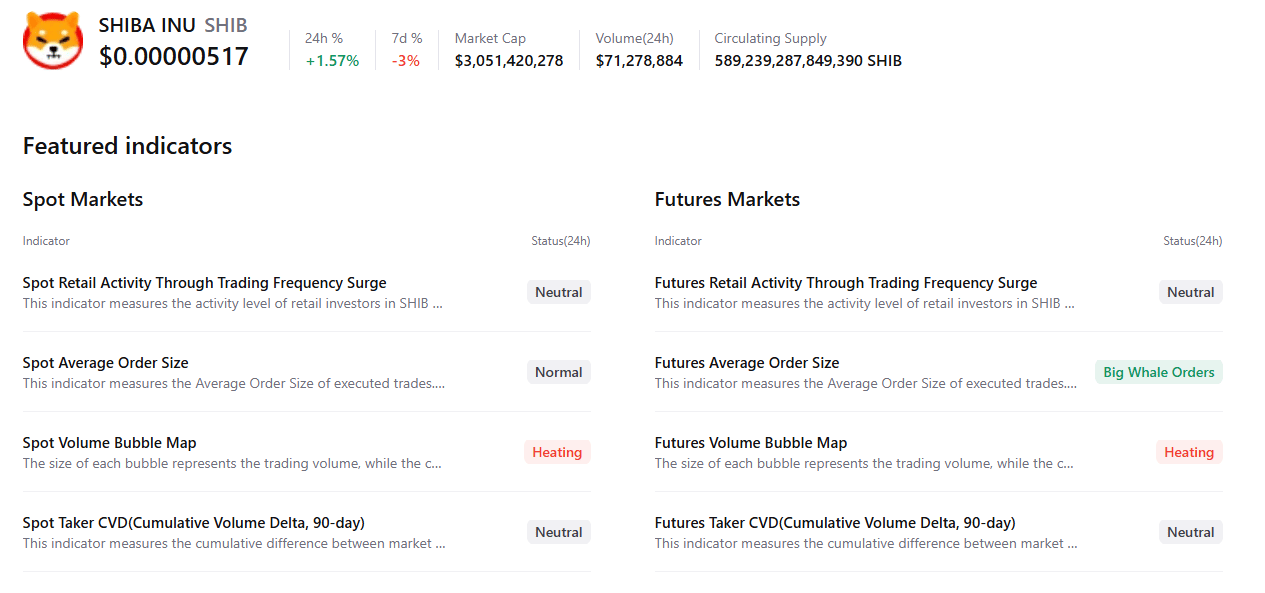
CryptoQuant’s summary data also shows bearish bias. SHIB’s spot and futures markets show heating market conditions, while futures markets show large whale orders after the recent price surge. Other metrics remain neutral, highlighting a mixed and cautious sentiment among traders.
Shiba Inu technical outlook: Key support holds strong
Shiba Inu price trades around $0.00000516 on Wednesday after rebounding nearly 4% earlier this week, following a retest of the key 50-day EMA around $0.00000489.
If SHIB continues its recovery, it could extend the rally toward the 200-day EMA at $0.00000569.
Momentum indicators show mixed sentiment: The daily Relative Strength Index (RSI) reads 54 and is rising, indicating strengthening bullish momentum. However, the Moving Average Convergence Divergence (MACD) showed a bearish crossover on Sunday with rising red histogram bars, indicating bearish bias.
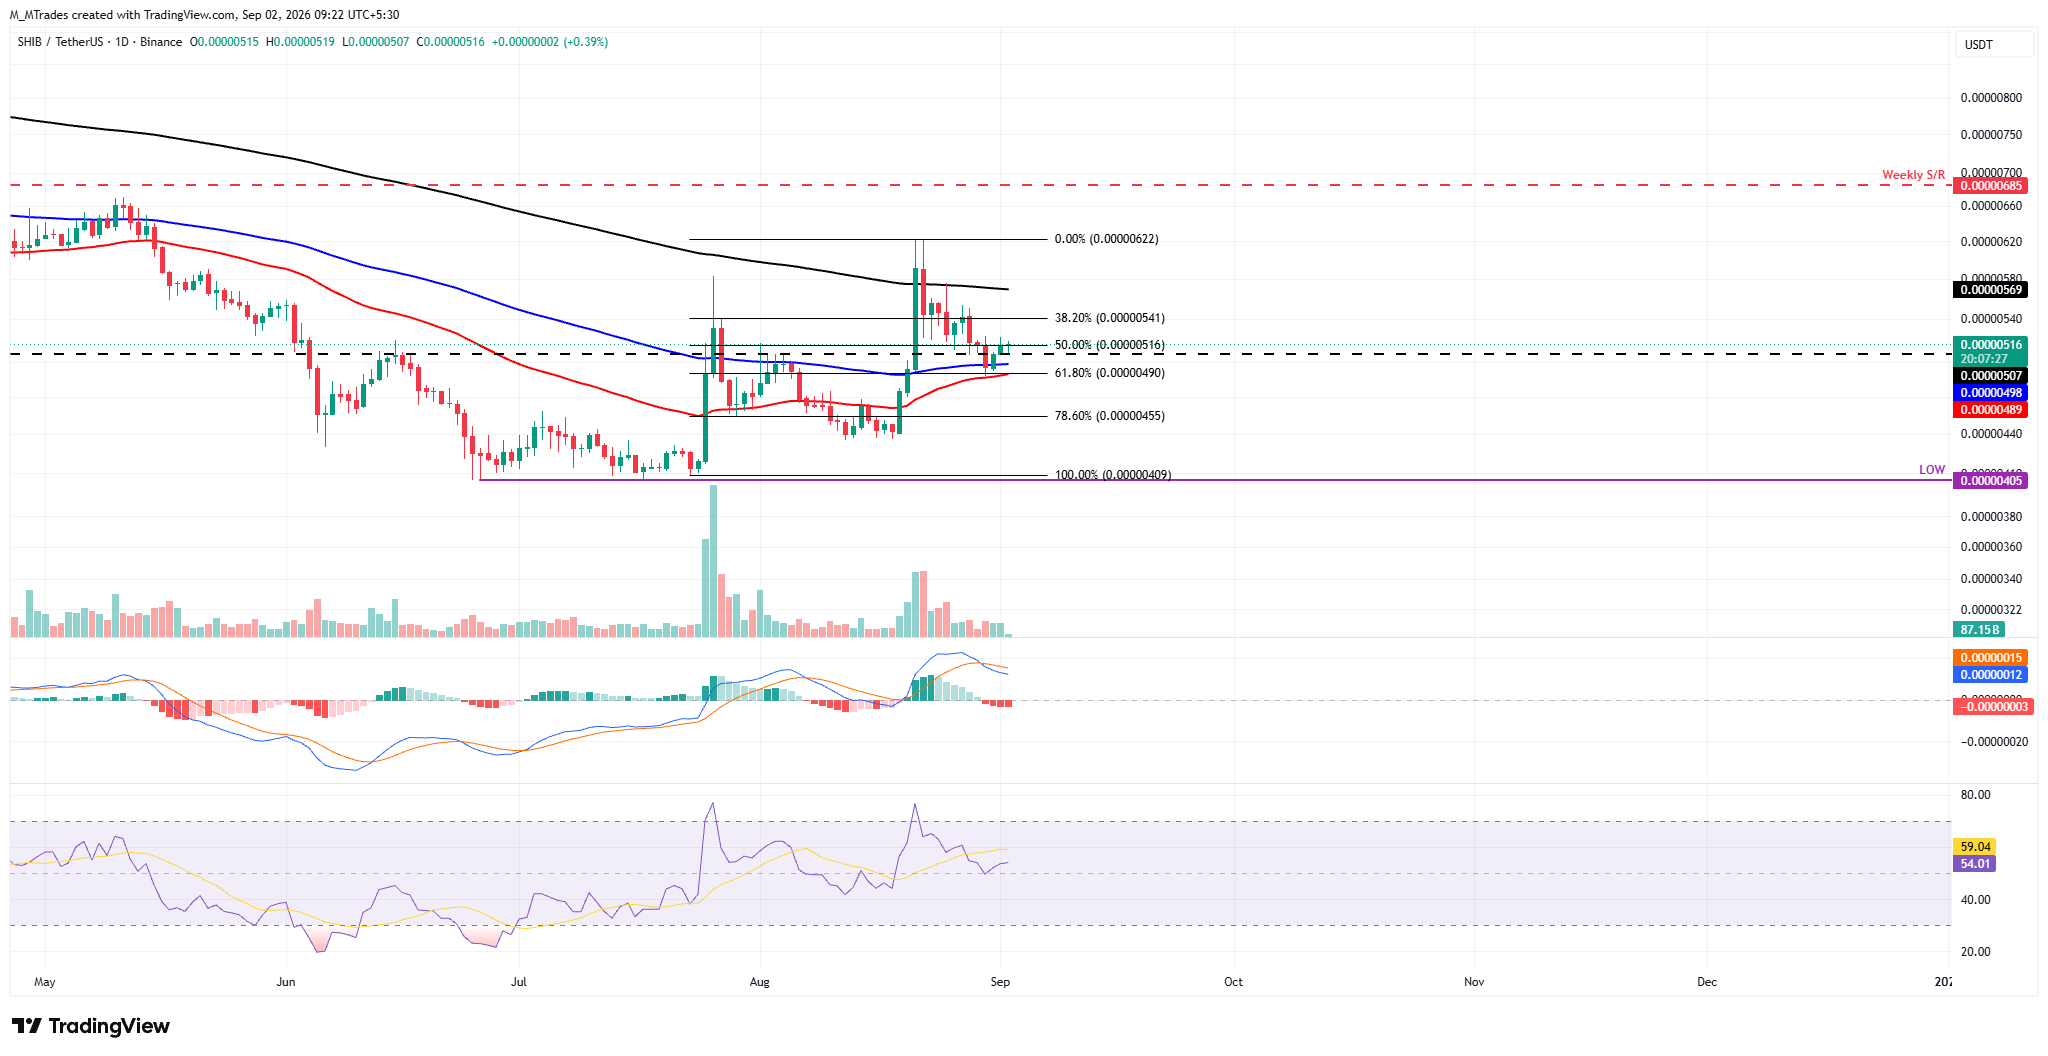
If SHIB faces a correction, it could extend the decline toward the 50-day EMA at $0.00000489.
Nothing in this material constitutes investment advice, personal recommendation, investment research, an offer, or a solicitation to buy or sell any financial instrument. The content has been prepared without consideration of your individual investment objectives, financial situation, or needs, and should not be treated as such.
Past performance is not a reliable indicator of future performance and/or results. Forward-looking scenarios or forecasts are not a guarantee of future performance. Actual results may differ materially from those anticipated.
Mitrade makes no representation or warranty as to the accuracy or completeness of the information provided and accepts no liability for any loss arising from reliance on such information.
Recommended Articles


