



FTAI Aviation Ltd Stock (FTAI) Closed Up by 7.42% on Sep 3: What Signal Does It Send?
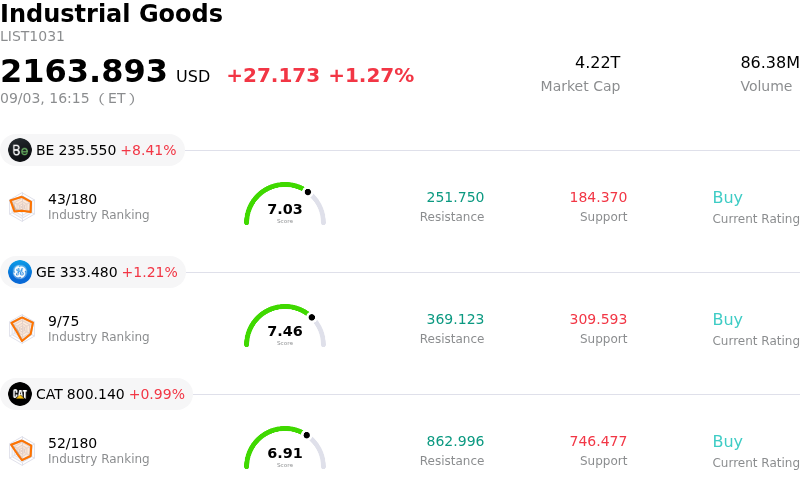
FTAI Aviation Ltd (FTAI) closed up by 7.42%. The Industrial Goods sector is up by 1.27%. The company outperformed the industry. Top 3 stocks by turnover in the sector: Bloom Energy Corp (BE) up 8.41%; General Electric Co (GE) up 1.21%; Caterpillar Inc (CAT) up 0.99%.
What is driving FTAI Aviation Ltd (FTAI)’s stock price up today?
FTAI Aviation saw a prominent upward session as buyers returned to the stock following a period of short-term selling pressure. The advance was largely driven by a technical rebound from oversold conditions, with market participants stepping in to capitalize on a discounted valuation after several consecutive sessions of decline.
Fundamentally, investor enthusiasm continues to be anchored by the company's expanding strategic capital initiatives. A major driver of medium-term confidence was the recent closing of a multi-billion-dollar syndicated warehouse financing facility for its Strategic Capital investment vehicle. This facility provides substantial capital capacity to acquire on-lease mid-life narrowbody aircraft, directly feeding high-margin engine maintenance and module exchange business into FTAI's Aerospace Products segment.
Wall Street's prevailing constructive outlook has further supported sentiment. Analysts maintain predominantly bullish ratings and price targets well above current trading levels, citing robust growth in maintenance activity, strong quarterly revenue performance, and an increased dividend payout. Recent institutional stake disclosures have reinforced confidence in the durability of the company's asset-light leasing and engine services model.
While broader macroeconomic caution and fluctuations in energy prices or interest rate expectations may maintain elevated volatility across industrial and aerospace equities, FTAI's reinforced balance sheet and solid core demand drivers leave it well-positioned within the aviation asset management space.
Technical Analysis of FTAI Aviation Ltd (FTAI)
Technically, FTAI Aviation Ltd (FTAI) shows a MACD (12,26,9) value of -2.024, indicating a sell signal. The RSI at 45.646 suggests neutral condition and the Williams %R at 70.478 suggests sell condition. Please monitor closely.
Fundamental Analysis of FTAI Aviation Ltd (FTAI)
FTAI Aviation Ltd (FTAI) is in the Industrial Goods industry. Its latest annual revenue is $2.51B, ranking 32 in the industry. The net profit is $477.49M, ranking 17 in the industry. Company Profile
Over the past month, multiple analysts have rated the company as Buy, with an average price target of $366.50, a high of $600.00, and a low of $290.00.
More details about FTAI Aviation Ltd (FTAI)
Company Specific Risks:
- Aviation Leasing Guidance Cut and Earnings Slippage: Ongoing sentiment drag from Q2 earnings missing consensus estimates ($1.13 EPS vs. $1.32 expected) and management lowering 2026 Aviation Leasing EBITDA and free cash flow projections, which triggered recent analyst price target reductions.
- High Leverage and Debt Service Burden: The closing of a $2.0 billion warehouse financing facility (expandable to $3.0 billion) for the 2026 SPV increases debt obligations, leaving FTAI with an elevated debt-to-equity ratio of 8.55 and heightened vulnerability to elevated long-term interest rates.
- Execution Risks in Business Model Pivot: Pivoting from traditional balance-sheet leasing toward fee-based asset management and scaling the aeroderivative gas-turbine Power segment exposes the company to operational complexity, module delivery bottlenecks, and potential lessee default risks.
- Premium Valuation and Technical Overhead: Trading at a trailing P/E ratio above 40x—significantly higher than aerospace sector averages—the stock remains vulnerable to valuation markdowns, with price action remaining under pressure below its 50-day and 200-day moving averages.
Nothing in this material constitutes investment advice, personal recommendation, investment research, an offer, or a solicitation to buy or sell any financial instrument. The content has been prepared without consideration of your individual investment objectives, financial situation, or needs, and should not be treated as such.
Past performance is not a reliable indicator of future performance and/or results. Forward-looking scenarios or forecasts are not a guarantee of future performance. Actual results may differ materially from those anticipated.
Mitrade makes no representation or warranty as to the accuracy or completeness of the information provided and accepts no liability for any loss arising from reliance on such information.
Recommended Articles


