



Agnico Eagle Mines Ltd Stock (AEM) Closed Up by 3.07% on Sep 22: Drivers Behind the Movement
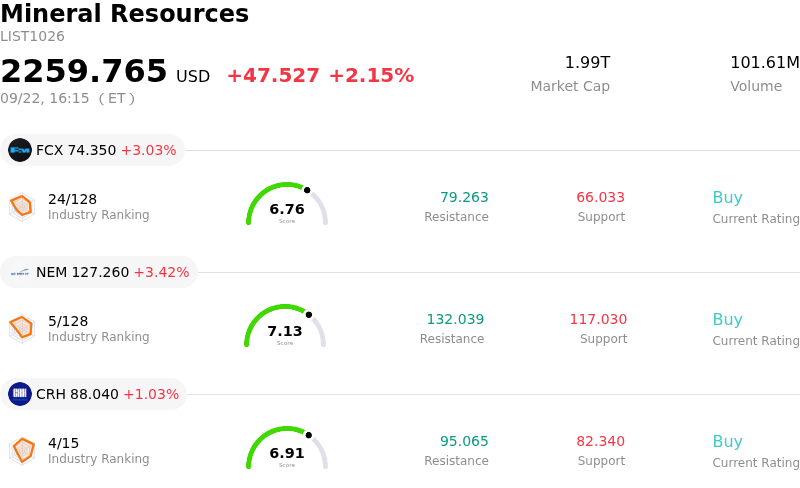
Agnico Eagle Mines Ltd (AEM) closed up by 3.07%. The Mineral Resources sector is up by 2.15%. The company outperformed the industry. Top 3 stocks by turnover in the sector: Freeport-McMoRan Inc (FCX) up 3.03%; Newmont Corporation (NEM) up 3.42%; CRH PLC (CRH) up 1.03%.
What is driving Agnico Eagle Mines Ltd (AEM)’s stock price up today?
Agnico Eagle Mines experienced notable upward movement accompanied by intraday volatility, largely driven by a firming environment for gold prices and favorable institutional commentary. Following recent macroeconomic adjustments from monetary authorities, precious metal markets stabilized as investors shifted focus back to persistent inflation dynamics and structural central bank demand for physical gold. As a leading senior gold producer, Agnico Eagle directly benefits from elevated bullion prices, which bolster realization rates, widen operating margins, and generate robust free cash flow.
A key catalyst behind the positive price action was encouraging Wall Street coverage and strategic corporate announcements. Analysts at major financial institutions, including RBC Capital, raised their price targets on the company, citing its top-tier asset portfolio and superior execution relative to industry peers. Furthermore, management demonstrated continued capital discipline by engaging in targeted early-stage exploration investments while remaining committed to its standalone organic growth trajectory, reinforcing market confidence in its long-term operational strategy.
From a fundamental and market sentiment perspective, institutional investors continue to favor Agnico Eagle as a core holding within the basic materials sector. Although the mining industry faces persistent input cost pressures and operational adjustments, Agnico Eagle's solid balance sheet, strong net profitability, and attractive return profile make it a preferred vehicle for defensive and inflation-hedging allocations. The intraday trading swings reflected active portfolio rebalancing and opportunistic buying as market participants capitalized on recent pullbacks, pushing the stock higher.
Technical Analysis of Agnico Eagle Mines Ltd (AEM)
Technically, Agnico Eagle Mines Ltd (AEM) shows a MACD (12,26,9) value of -3.417, indicating a neutral signal. The RSI at 57.085 suggests neutral condition and the Williams %R at 31.932 suggests buy condition. Please monitor closely.
Fundamental Analysis of Agnico Eagle Mines Ltd (AEM)
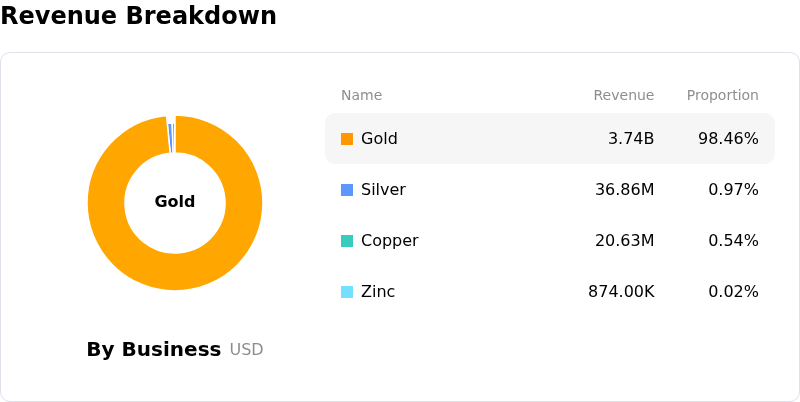
Agnico Eagle Mines Ltd (AEM) is in the Mineral Resources industry. Its latest annual revenue is $11.91B, ranking 19 in the industry. The net profit is $4.46B, ranking 5 in the industry. Company Profile
Over the past month, multiple analysts have rated the company as Buy, with an average price target of $232.36, a high of $355.00, and a low of $94.56.
More details about Agnico Eagle Mines Ltd (AEM)
Company Specific Risks:
- Valuation Premium vs. Slower Growth Profile: Wall Street consensus downgrades to "Hold" reflect concern over valuation expansion, with the forward non-GAAP PEG ratio climbing to 2.34x (a 91% premium to the mining sector) while 3-to-5-year EPS growth of 6.93% significantly trails the sector median of 12.75%.
- Canadian Malartic Pit Wall Instability and Guidance Cut: Unplanned rock mass movement along the north wall of the Barnat open pit forced a temporary suspension of in-pit mining, causing management to cut 2026 production targets by 60,000 to 80,000 ounces and flagging potential annual output losses of up to 150,000 ounces through 2028.
- Elevated Capital Outlays on Pipeline Projects: Expanding project commitments—including high-cost developments at Hope Bay and underground infrastructure at Detour Lake—require sustained heavy reinvestment, leaving free cash flow metrics vulnerable to operational cost overruns or development delays.
- Tightened Technical Support and Commodity Price Exposure: Intraday trading exhibits heightened sensitivity to fluctuations in spot gold prices, with technical price action compressing near key support levels where any broader pullbacks in precious metals threaten a sharp technical breakdown below established volatility channels.
Nothing in this material constitutes investment advice, personal recommendation, investment research, an offer, or a solicitation to buy or sell any financial instrument. The content has been prepared without consideration of your individual investment objectives, financial situation, or needs, and should not be treated as such.
Past performance is not a reliable indicator of future performance and/or results. Forward-looking scenarios or forecasts are not a guarantee of future performance. Actual results may differ materially from those anticipated.
Mitrade makes no representation or warranty as to the accuracy or completeness of the information provided and accepts no liability for any loss arising from reliance on such information.
Recommended Articles


