



US Dollar Index pushes higher on the case for another Fed increase
- DXY pushes to its highest since late July on the case for another increase.
- Futures put a Fed rate increase on October 28 at 55.36%.
- Wednesday's flash services PMI is forecast at 56, after 56.5.
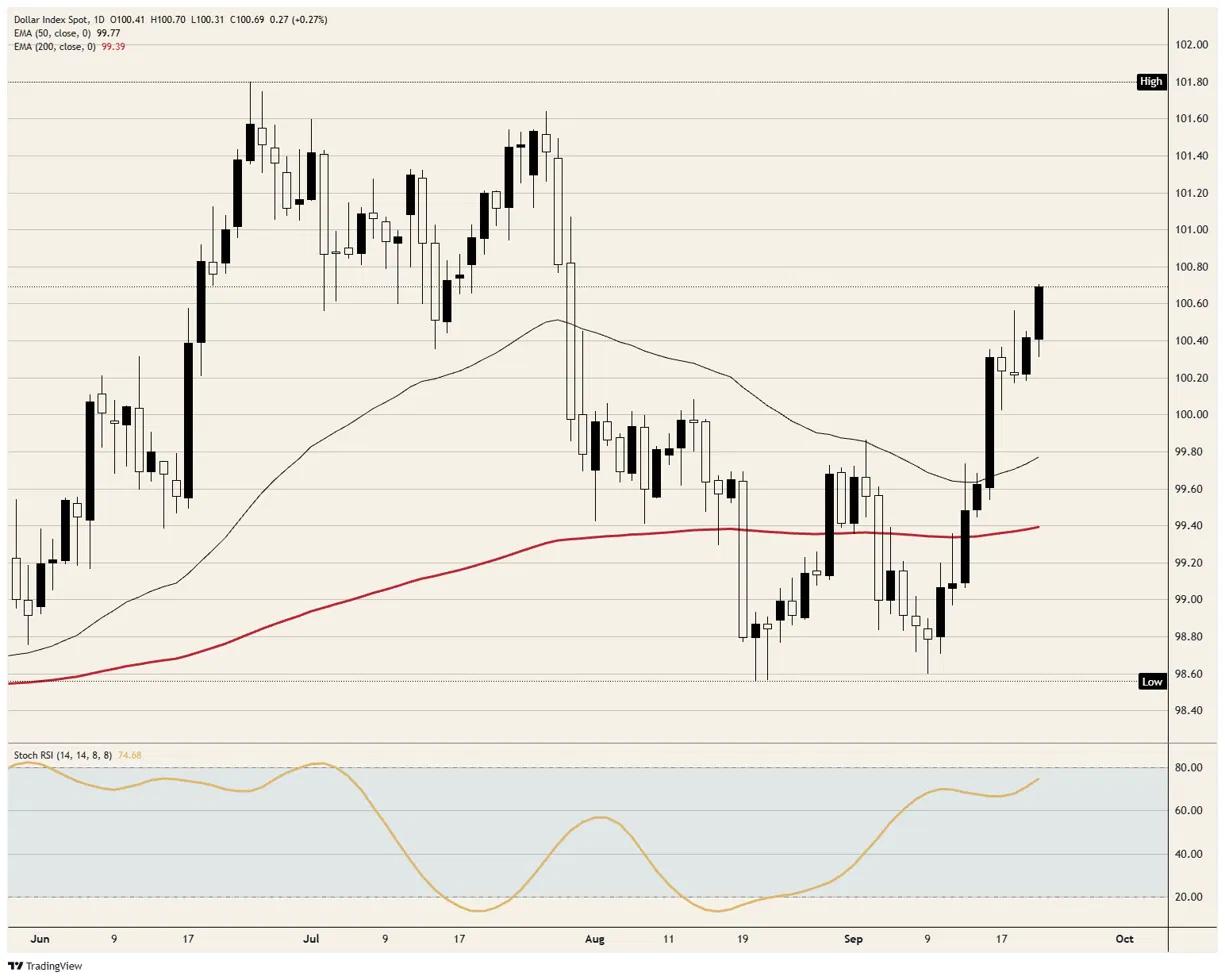
The Dollar Index trades near 100.70, its highest level since late July. It has climbed through five straight sessions of falling Crude Oil, the opposite of how the war has moved it for most of this year. The Fed is the reason. It raised rates on September 16, signalled at least one more increase this year, and its officials have spent the days since backing that up.
Cheaper Crude Oil is supposed to cost the Dollar
Japanese news agency Kyodo, citing a senior Iranian official, reported that Iran would let ships back through the Strait of Hormuz inside a week. The conditions are that the United States ends the blockade of Iran's ports and stops its military operations around the strait, and the offer hasn't been independently confirmed. Crude Oil fell on the report, and Brent, the global benchmark, hit its lowest price since September 8.
Crude Oil reaches the Dollar through the Fed. Cheaper Crude Oil means less inflation, which means less reason for the Fed to raise rates again. Fewer increases mean less extra interest for holding Dollars instead of Euros or Yen. The offer went to Washington through mediators on September 16 and moved Crude Oil only once it was reported.
Before the war, about a fifth of the world's Crude Oil and liquefied natural gas went through the strait. Saudi Arabia is also testing a restart of its East-West pipeline, which carries Crude Oil from its Gulf coast to the Red Sea and around the strait. More barrels getting out means a lower price, and a lower price means lower odds of another Fed increase, which is how both stories reach the Dollar Index.
A seven-week high on odds a little better than even
Crude Oil came off its low after Trump used his United Nations speech to put a deal with Iran after the November 3 midterms. The Dollar Index went to its session high after Boston Fed President Collins spoke at 15:00 GMT. She said she supported the September 16 increase and warned that inflation could stay above the Fed's 2% target. The Fed's own projections have it staying there until after 2028.
Prices in the futures market put the chance of an increase on October 28 at 55.36%, against 44.64% for no change. Those odds slipped on the Hormuz report, and the Dollar Index slipped with them. Another increase would widen what Dollars earn over the other currencies in the index. ADP's four-week average of private-sector hiring, the only American data of the session, came in at 20K against 16.75K before it, a small push in the same direction.
The case for October doesn't rest on the barrel. Minneapolis Fed President Kashkari has said inflation is too high across the whole economy rather than only in the price of Crude Oil. Chicago Fed President Goolsbee and St. Louis Fed President Musalem said much the same on Monday. That is why the Hormuz report has moved Crude Oil more than it has moved the Dollar.
The Yen fell for a third session in a row, in thin trading with Tokyo shut for public holidays through Wednesday. That came even though the Bank of Japan (BoJ) raised its rate to 1.25% on September 18. The Yen is part of the Dollar Index, so a weaker Yen means a higher index.
Wednesday's surveys are early estimates, and the odds will move on them anyway
S&P Global's flash purchasing surveys land Wednesday at 13:45 GMT, with services forecast at 56 after 56.5 and manufacturing at 53.5 after 53.9. A Purchasing Managers Index (PMI) above 50 means more firms reported growth than decline, so both are forecast to keep growing a little more slowly. The final versions come out in early October. Stronger flash numbers would add to the same October odds the Dollar Index rose and fell with on Tuesday, and weaker ones would take from them.
Jobless claims on Thursday at 12:30 GMT are forecast at 201K after 196K. Durable goods orders, which count orders for goods meant to last three years or more, follow on Friday at 12:30 GMT and are forecast at -0.4% after 1.1%.
The University of Michigan survey on Friday at 14:00 GMT carries what households expect inflation to be over the coming year, forecast at 4.6%, exactly where it was last time. That makes the week's only inflation reading one that nobody expects to change.
Levels and bias
Resistance: Tuesday's high near 100.70 is the highest since late July. Above it, 101.00, then the late-July highs just above 101.50, the level the Dollar fell from at the end of July.
Support: 100.50, where Friday's run stopped and Tuesday's went through, is the first floor. Below it, Tuesday's low near 100.30, where the dip on the Hormuz report stopped, then the Friday and Monday lows near 100.20.
Bias: Bullish above 100.50. The first objective is 101.00 and the second is the late-July highs just above 101.50. The daily Stochastic Relative Strength Index (Stoch RSI), a momentum gauge, is near 75 and rising, just short of the 80 line that marks a stretched market. The bullish case is wrong on a daily close below 100.20.
DXY daily chart
US Dollar FAQs
The US Dollar (USD) is the official currency of the United States of America, and the ‘de facto’ currency of a significant number of other countries where it is found in circulation alongside local notes. It is the most heavily traded currency in the world, accounting for over 88% of all global foreign exchange turnover, or an average of $6.6 trillion in transactions per day, according to data from 2022. Following the second world war, the USD took over from the British Pound as the world’s reserve currency. For most of its history, the US Dollar was backed by Gold, until the Bretton Woods Agreement in 1971 when the Gold Standard went away.
The most important single factor impacting on the value of the US Dollar is monetary policy, which is shaped by the Federal Reserve (Fed). The Fed has two mandates: to achieve price stability (control inflation) and foster full employment. Its primary tool to achieve these two goals is by adjusting interest rates. When prices are rising too quickly and inflation is above the Fed’s 2% target, the Fed will raise rates, which helps the USD value. When inflation falls below 2% or the Unemployment Rate is too high, the Fed may lower interest rates, which weighs on the Greenback.
In extreme situations, the Federal Reserve can also print more Dollars and enact quantitative easing (QE). QE is the process by which the Fed substantially increases the flow of credit in a stuck financial system. It is a non-standard policy measure used when credit has dried up because banks will not lend to each other (out of the fear of counterparty default). It is a last resort when simply lowering interest rates is unlikely to achieve the necessary result. It was the Fed’s weapon of choice to combat the credit crunch that occurred during the Great Financial Crisis in 2008. It involves the Fed printing more Dollars and using them to buy US government bonds predominantly from financial institutions. QE usually leads to a weaker US Dollar.
Quantitative tightening (QT) is the reverse process whereby the Federal Reserve stops buying bonds from financial institutions and does not reinvest the principal from the bonds it holds maturing in new purchases. It is usually positive for the US Dollar.
Nothing in this material constitutes investment advice, personal recommendation, investment research, an offer, or a solicitation to buy or sell any financial instrument. The content has been prepared without consideration of your individual investment objectives, financial situation, or needs, and should not be treated as such.
Past performance is not a reliable indicator of future performance and/or results. Forward-looking scenarios or forecasts are not a guarantee of future performance. Actual results may differ materially from those anticipated.
Mitrade makes no representation or warranty as to the accuracy or completeness of the information provided and accepts no liability for any loss arising from reliance on such information.
Recommended Articles


