



Pi Network Price Forecast: PI pulls back despite Protocol v27 completing final testnet step
- Pi Network edges lower on Tuesday, retreating from the day's high of $0.0947 and putting previous day’s gains at risk.
- Protocol v27 completes its final step on the testnet, delivering 250 transactions per block with zero failures.
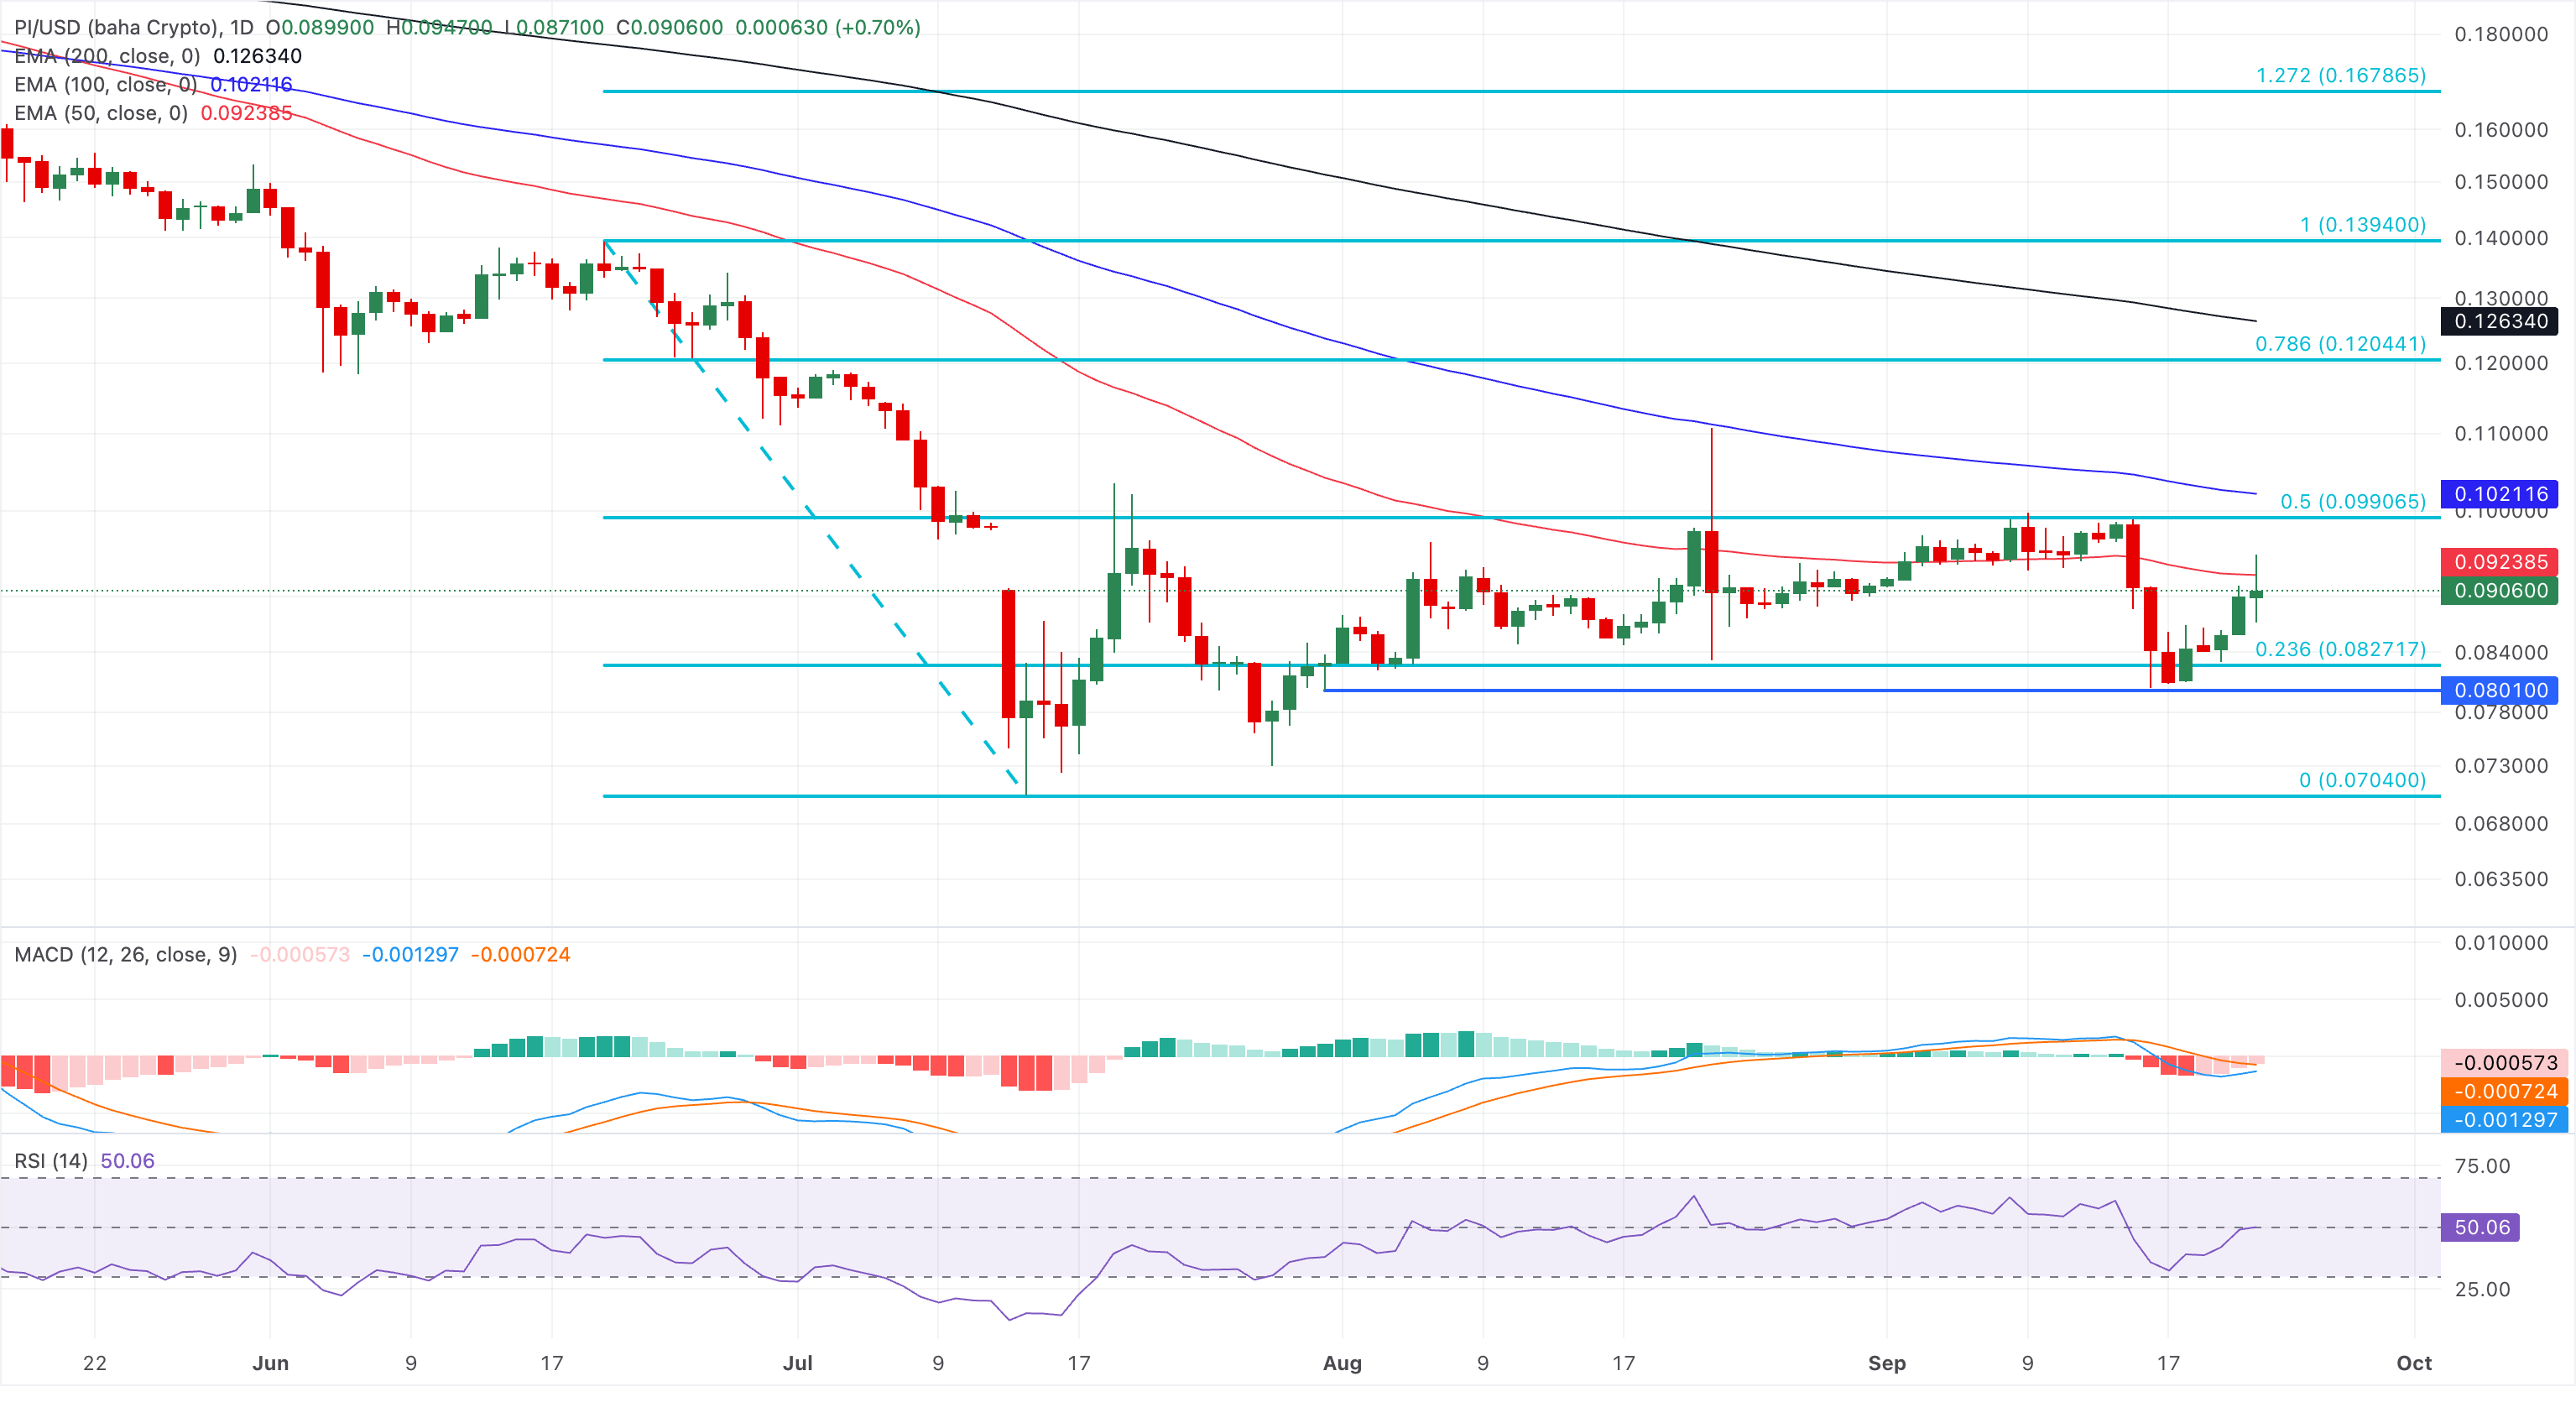
- PI needs to reclaim its 50-day EMA at around $0.0923 and the $0.1000 psychological level to sustain an upward trend.
Pi Network (PI) is trading in the red on Tuesday, retreating from the day’s high of $0.0947 and risking a steeper correction. The upcoming protocol v27 completes its final step on the testnet, after which the smart contract feature will roll out to the mainnet. The technical outlook for PI is bearish, with the price capped below the 50-day Exponential Moving Average (EMA) at $0.0923 and the $0.1000 psychological threshold.
Pi mainnet poised for smart contract upgrade
The Pi Network testnet monitor shows that the upcoming protocol v27 completed its final step, delivering 250 transactions per block, without any failures. This upgrade’s deployment to the mainnet could enhance smart contract authentication on the network, following the protocol v26 release, which supports advanced decentralized applications.
Technical outlook: Pi Network capped below key resistances
Pi Network trades around $0.0890 at press time on Tuesday, struggling to extend its nearly 5% gains from the previous day. PI token recovery stalls below the 50-day EMA at $0.0923, with the 100-day EMA at $0.1021 and the 200-day EMA at $0.1263 reinforcing a broader downslope.
Momentum is soft, as the Relative Strength Index (RSI) hovers near 47 on the daily chart, while the Moving Average Convergence Divergence (MACD) is below the zero and signal lines, with a contracting negative histogram, hinting at some stabilization after the recent sell-off.
A confirmed breakout above the 50-day EMA at $0.00923 could target the 50% retracement level at $0.0990, measured from $0.1394 to $0.0704.
On the downside, the 23.6% Fibonacci retracement level at $0.0827 could serve as the immediate support floor, followed by the July 31 low at $0.0801. Beyond this, any deeper pullback could risk testing the $0.0704 record low.
(The technical analysis of this story was written with the help of an AI tool. Know more.)
Nothing in this material constitutes investment advice, personal recommendation, investment research, an offer, or a solicitation to buy or sell any financial instrument. The content has been prepared without consideration of your individual investment objectives, financial situation, or needs, and should not be treated as such.
Past performance is not a reliable indicator of future performance and/or results. Forward-looking scenarios or forecasts are not a guarantee of future performance. Actual results may differ materially from those anticipated.
Mitrade makes no representation or warranty as to the accuracy or completeness of the information provided and accepts no liability for any loss arising from reliance on such information.
Recommended Articles


