



MSTR Stock Price Forecast: As Bitcoin Reclaims $85,000, Can MicroStrategy Keep Rising After Rebound?
TradingKey - On September 21 US Eastern Time, Bitcoin (BTC) broke above $85,000, and Strategy (MSTR) closed up 9.47% at $168.50. In pre-market trading on September 22, as of press time, MSTR dropped about 1.51%. Starting from the September 17 closing price, MSTR gained approximately 27% cumulatively over two trading days.
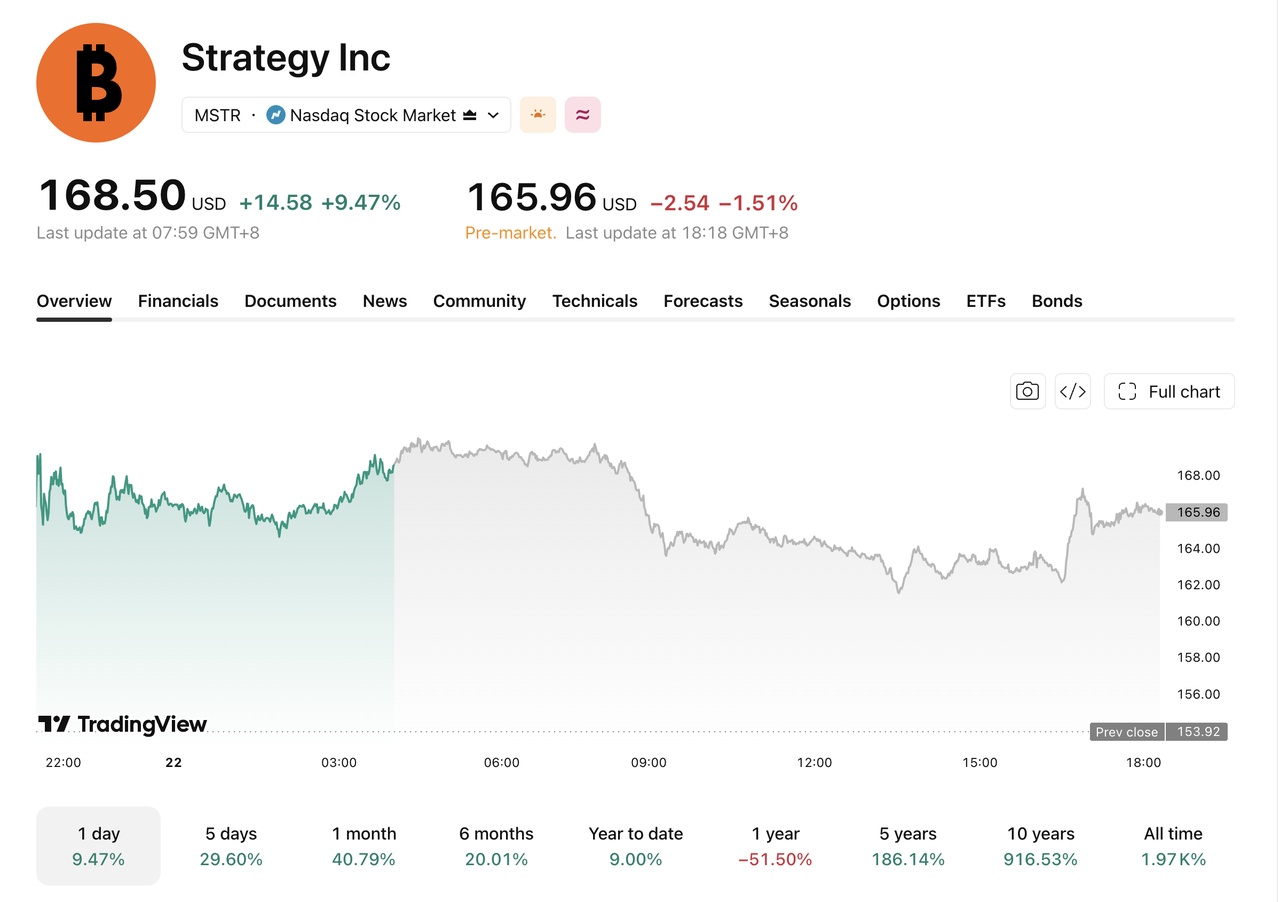
[Source: TradingView]
This round of gains was mainly driven by capital inflows returning to US spot Bitcoin ETFs and short covering, while Strategy's continued accumulation of BTC also boosted market sentiment for MSTR.
Strategy disclosed on September 21 that between September 14 and September 20, the company spent $75.7 million to purchase 950 BTC at an average purchase price of approximately $79,670. As of September 20, the company's holdings increased to 846,000 BTC, with a cumulative investment of $63.8 billion and an overall average purchase cost of about $75,416.
Based on a static calculation at a BTC price of $85,500, the market value of Strategy's holdings is approximately $72.33 billion, which is about $8.53 billion above its cumulative purchase cost.
Bitcoin ETFs See Nearly $1 Billion in Single-Day Inflows
U.S. spot Bitcoin ETFs recorded net inflows of $998.95 million on September 21, marking the ninth-largest single-day net inflow since their launch in January 2024. Capital inflows provided support for spot Bitcoin demand, while approximately $648 million in crypto short positions were liquidated over the same period, further amplifying short-term gains.
As of September 20, Strategy held 846,000 BTC with a cumulative investment of $63.8 billion, at an average purchase price of $75,416. As BTC rose to near $85,000, these assets generated an unrealized gain of approximately $8.1 billion relative to their cumulative purchase cost.
MSTR is not a simple reflection of BTC prices. The company raises capital through common stock, preferred stock, and debt instruments, and its stock price is also affected by financing costs, equity dilution, and changes in its premium relative to Bitcoin's net asset value.
When BTC rises, MSTR typically exhibits higher price elasticity; when BTC falls or its NAV premium shrinks, the drawdown may also be larger. Moving forward, attention will be on ETF capital flows and whether BTC can hold the $80,000 to $82,300 range.
MSTR Stock Technical Analysis: Eyes $193-$195 After Break Above $169.52
[Source: TradingView]
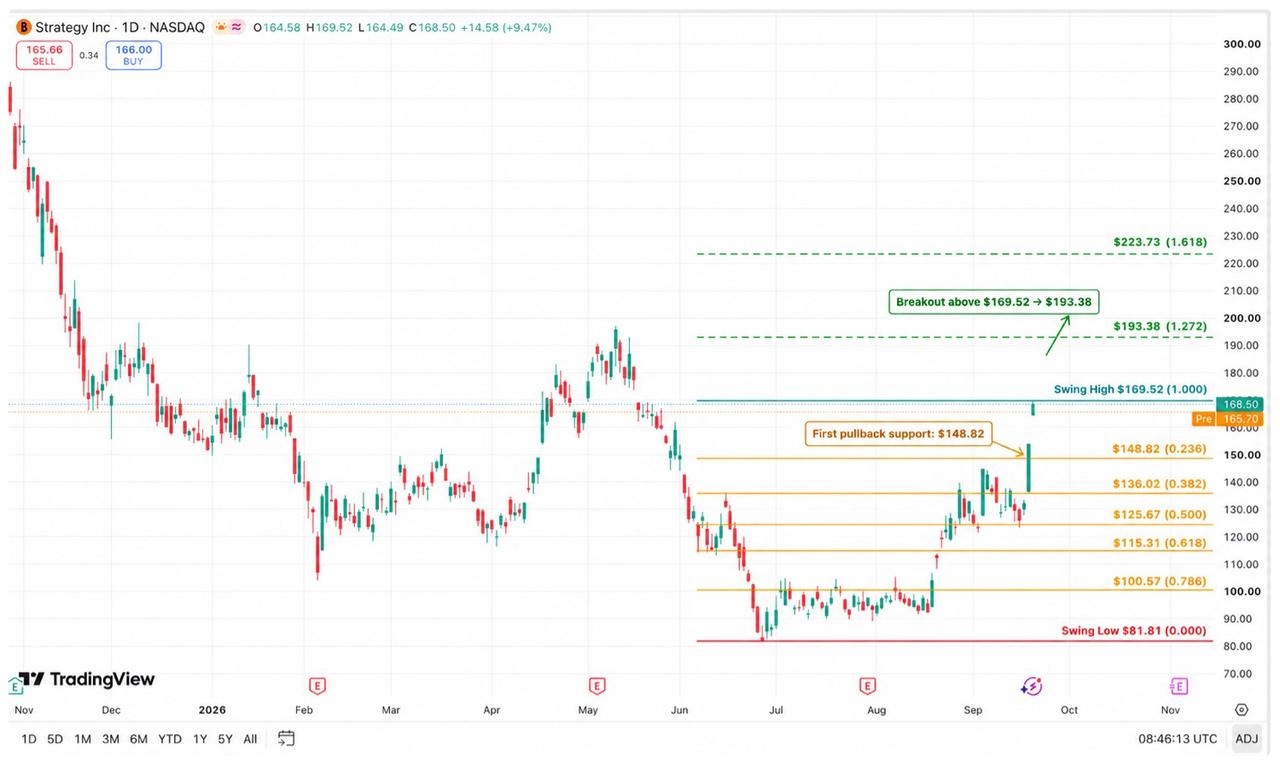
On the daily chart, MSTR stopped falling and rebounded after touching $81.81 on June 26, recently surging rapidly from the $125–$136 zone to $168.50, with its short-term structure strengthening noticeably. The stock price has broken above the 0.236 Fibonacci retracement level at $148.82 and is approaching the September 21 intraday high of $169.52.
To the upside, $169.52 is the current key breakout level. If the stock holds firmly on high volume, $180 could serve as an intermediate resistance level, followed by attention on the $193–$195 zone. Within this zone, $193.38 corresponds to the 1.272 Fibonacci extension level, while near $195 is the period high formed in May. Should it continue to break out, the 1.618 extension target is approximately $223.73.
To the downside, $148.82 is the primary support. If the stock pulls back but holds this level, the rebound structure can still be maintained; if it falls below, the next support levels are located at $136.02 and $125.67 in sequence. A further loss of $125.67 could see the price drop back to around $115.31.
Overall, MSTR is approaching a critical breakout area. Holding firmly above $169.52 will open up upside space toward $193–$195; if the breakout fails and falls below $148.82, the stock price may re-enter a consolidation range of $136–$149.
Nothing in this material constitutes investment advice, personal recommendation, investment research, an offer, or a solicitation to buy or sell any financial instrument. The content has been prepared without consideration of your individual investment objectives, financial situation, or needs, and should not be treated as such.
Past performance is not a reliable indicator of future performance and/or results. Forward-looking scenarios or forecasts are not a guarantee of future performance. Actual results may differ materially from those anticipated.
Mitrade makes no representation or warranty as to the accuracy or completeness of the information provided and accepts no liability for any loss arising from reliance on such information.
Recommended Articles


