



Hyperliquid Price Forecast: HYPE pulls back from record high as rally eyes $100
- Hyperliquid edges below $97 on Wednesday after hitting a record high of $98.03, following a 3% rise the previous day.
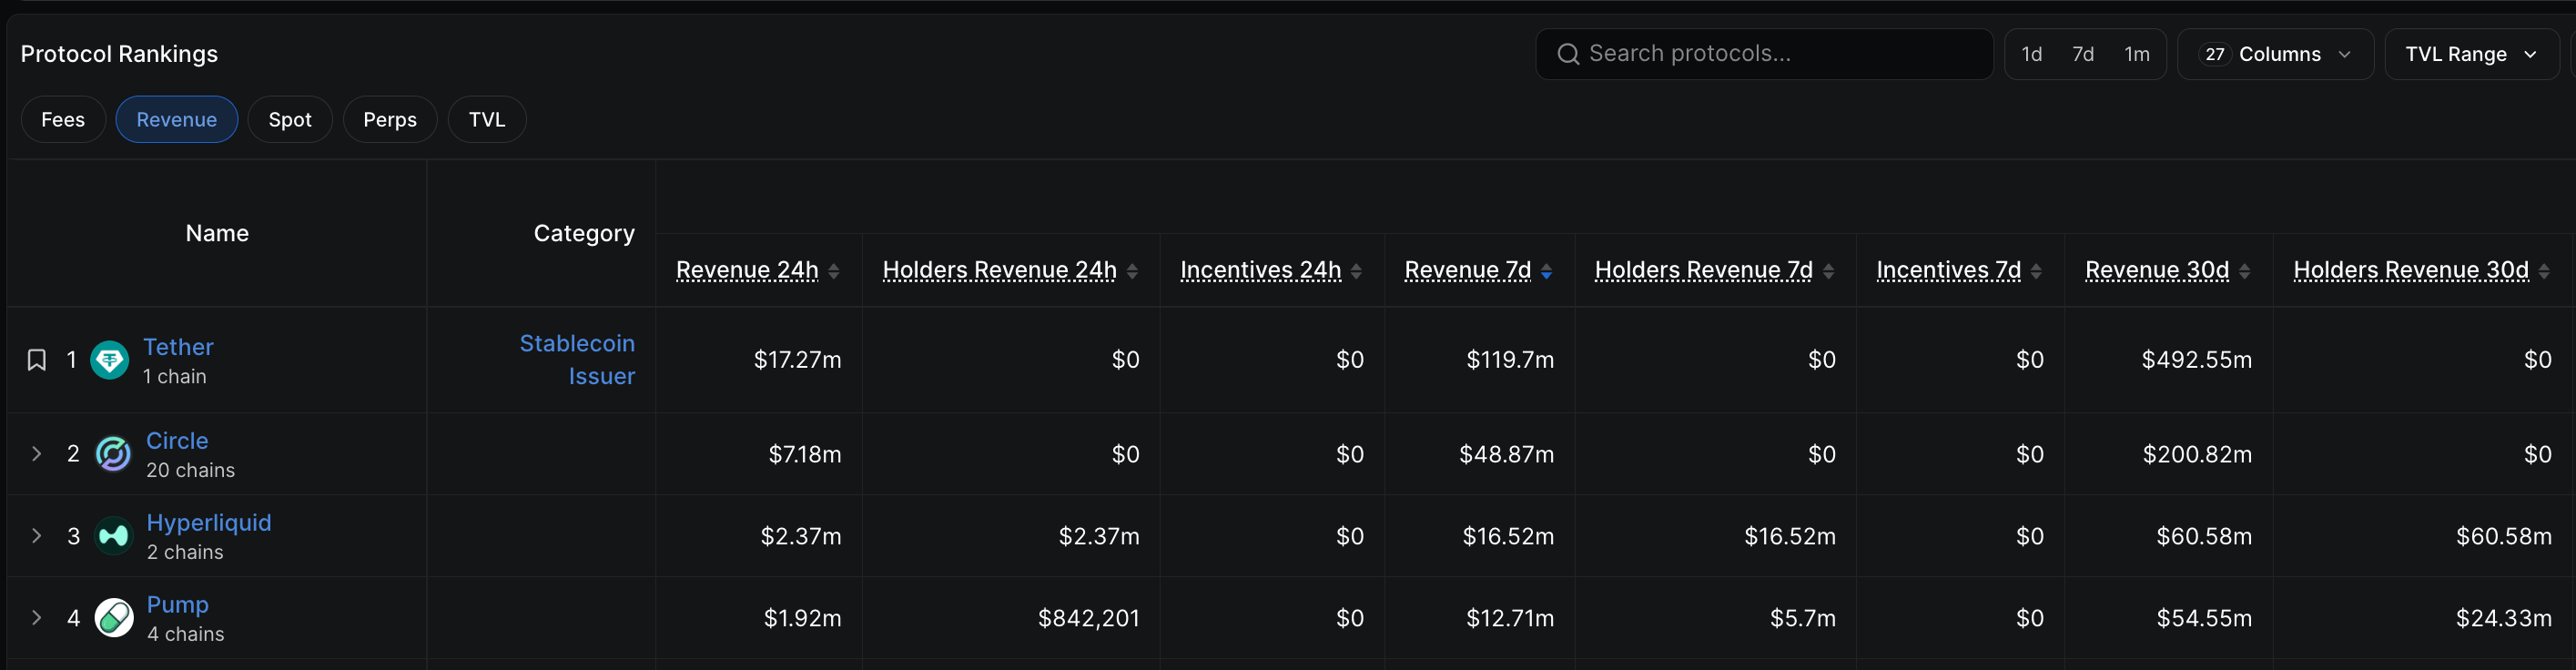
- DeFiLlama data shows Hyperliquid as the leading DeFi protocol by revenue, excluding stablecoins.
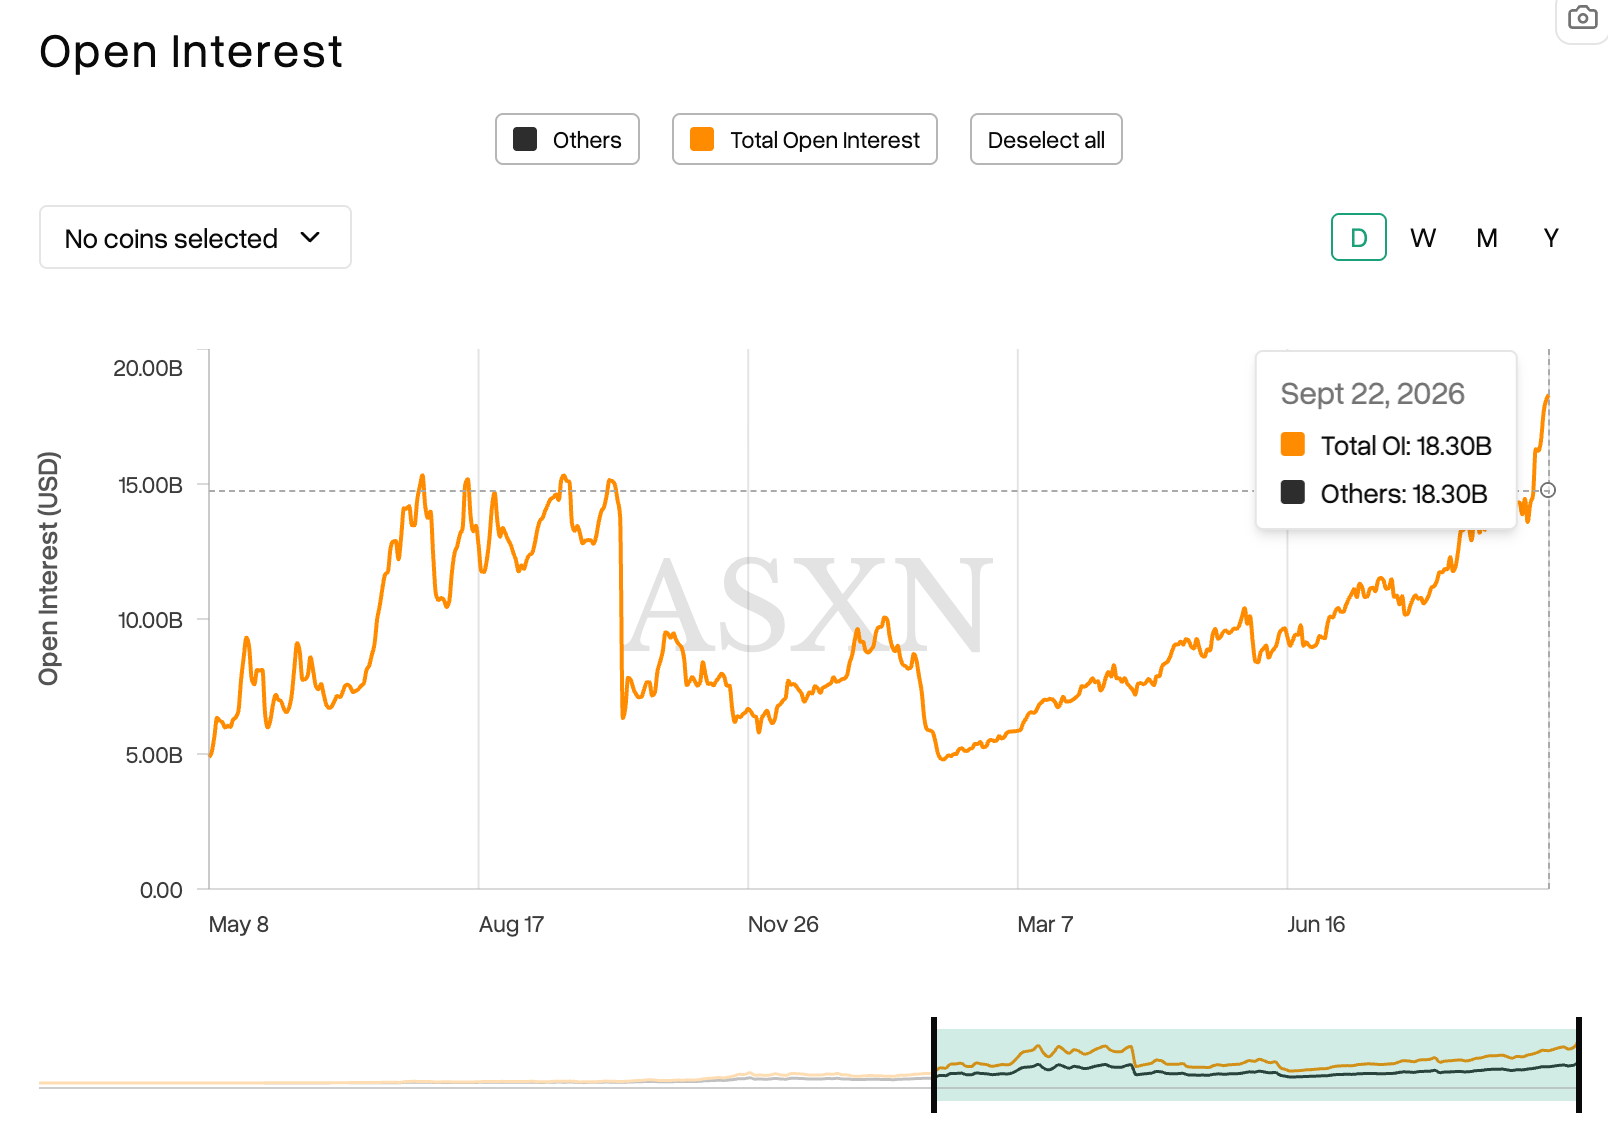
- Open interest on the Hyperliquid exchange reached an all-time high of $18 billion on Tuesday, indicating increased activity in perpetuals trading.
Hyperliquid (HYPE) price hovers around $96 at press time on Wednesday, retreating from the day’s high of $98.03, which also marked a new all-time high. The perpetuals-focused Decentralized Exchange (DEX) emerges as the leading protocol by revenue, excluding stablecoins, while on-platform Open Interest surpasses $18 billion.
The technical outlook for HYPE indicates an upside bias, with bullish momentum holding firm.
Steady revenue and rising perpetuals demand back the HYPE rally
The notional value of all active perpetual contracts on Hyperliquid recorded an all-time high of $18.13 billion on Tuesday. This surge in positional buildup on Hyperliquid suggests capital inflow driven by renewed demand for crypto perpetuals.
NEAR Protocol’s recent release of confidential perps, with Hyperliquid as the underlying trading exchange, and the launch of trailing stop orders support renewed perpetual demand.
On the other hand, Hyperliquid ranks third, after the stablecoin issuers, in revenue collected. DeFiLlama data shows the DEX collected $16.52 million over the last seven days, outpacing other DeFi protocols.
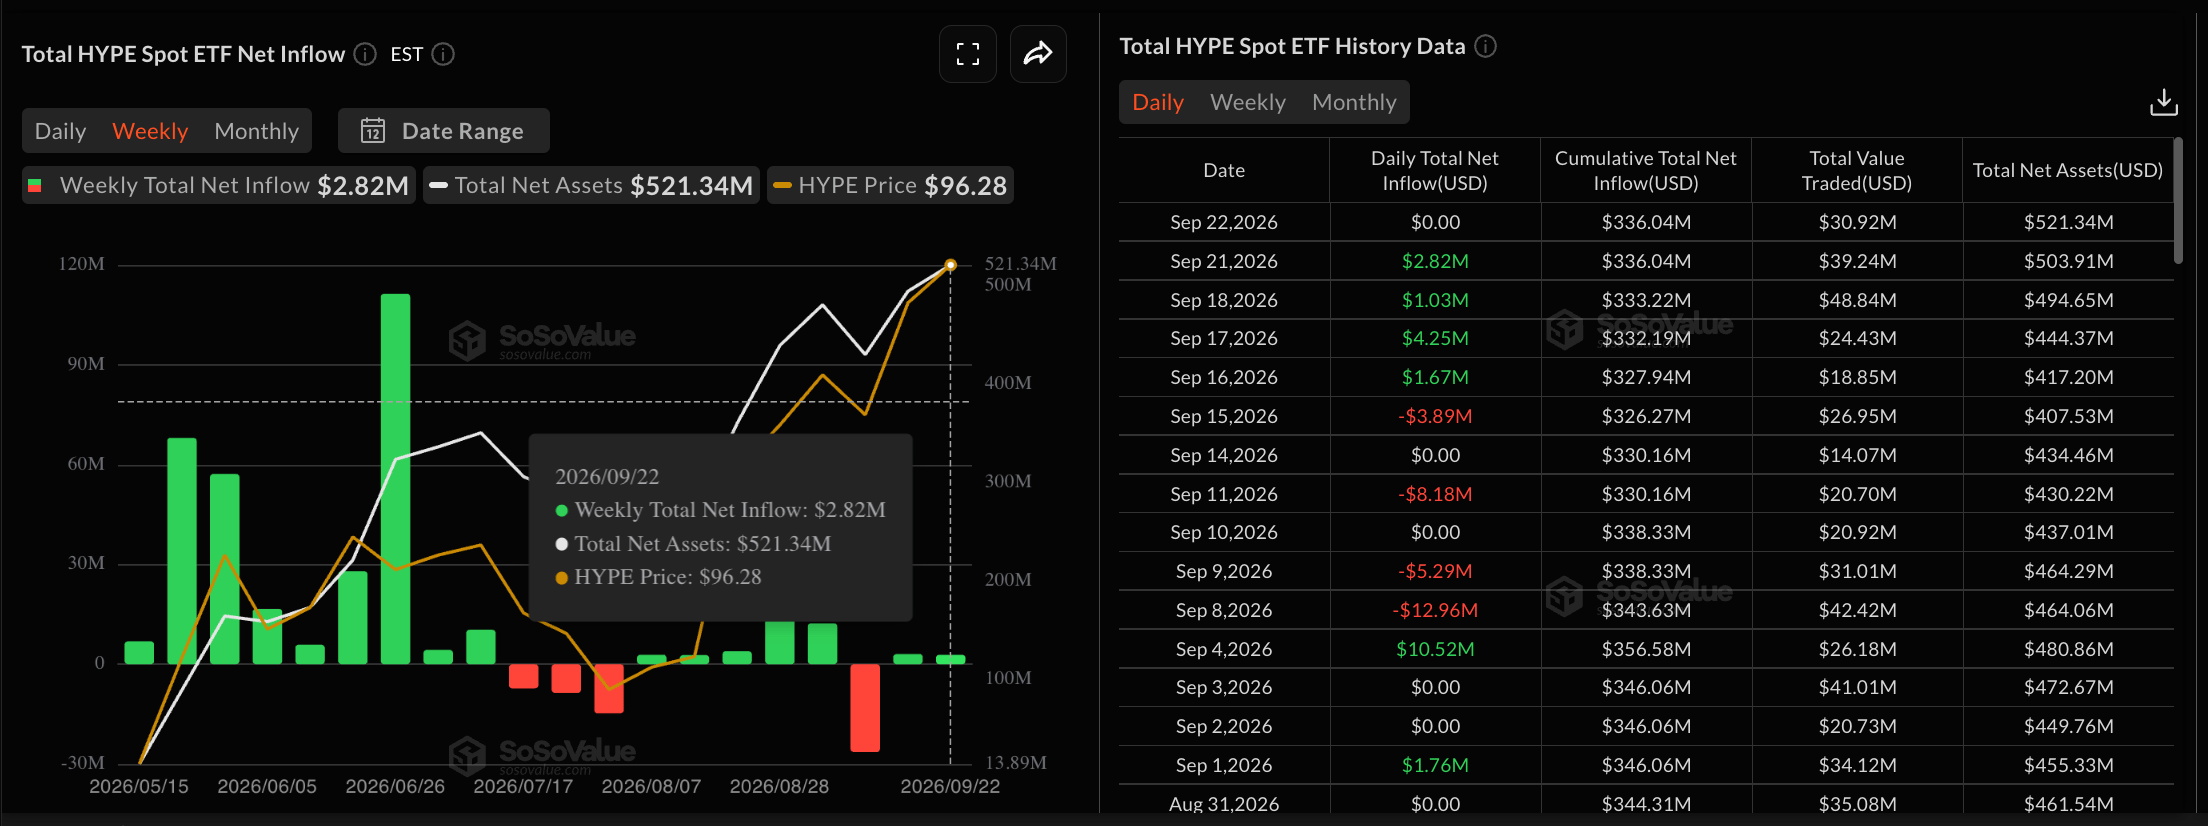
Meanwhile, the institutional confidence holds firm in HYPE, despite zero inflows on Tuesday, down from $2.82 million on Monday. The HYPE-focused Exchange Traded Funds (ETFs) are net positive, with $3.06 million in inflows last week after a $26.42 million outflow the previous period, suggesting firm institutional demand as the broader crypto market recovers.
Technical outlook: Will HYPE extend gains?
Hyperliquid trades around $96.90 at press time on Wednesday, sustaining a firm bullish bias after a 20% rally last week. HYPE extends its advance well above the 50-, 100-, and 200-period Exponential Moving Averages (EMAs) on the four-hour chart at $90.07, $86.60, and $81.75, respectively, all of which underpin a bullish long-term bias.
From a technical perspective, the Fibonacci retracement over the recent upswing from $75.21 to $94.55 suggests the 127.2% and 161.8% Fibonacci extension levels at $99.81 and $106.50, respectively, as the next key barriers.
Momentum is constructive but not extreme, as the Relative Strength Index (RSI) near 68 on the four-hour chart holds just below overbought territory. At the same time, the Moving Average Convergence Divergence (MACD) hovers flat just below its signal line, hinting at a consolidative pause.
On the downside, initial support is seen at the Fibonacci anchor near $94.55, followed by the 78.6% retracement at $90.41, which aligns with the 50-period EMA at $90.07 to form a dense demand zone on dips.
(The technical analysis of this story was written with the help of an AI tool. Know more.)
Nothing in this material constitutes investment advice, personal recommendation, investment research, an offer, or a solicitation to buy or sell any financial instrument. The content has been prepared without consideration of your individual investment objectives, financial situation, or needs, and should not be treated as such.
Past performance is not a reliable indicator of future performance and/or results. Forward-looking scenarios or forecasts are not a guarantee of future performance. Actual results may differ materially from those anticipated.
Mitrade makes no representation or warranty as to the accuracy or completeness of the information provided and accepts no liability for any loss arising from reliance on such information.
Recommended Articles


