



Intel Stock Price Forecast: INTC Nears $125, Can AI Server Demand Push Shares to $140?
TradingKey - On September 22 ET, Intel (INTC) closed up 1.69% at $123.86, touching an intraday high of $124.25. In the previous trading session, Intel surged 12.1%, gaining about 14% cumulatively over two trading sessions.
This rally was mainly driven by rising demand for AI inference. AI agents such as Meta (META)'s Muse gained market attention, prompting investors to reassess server CPU demand, while related stocks such as Intel, AMD (AMD), and Arm (ARM) strengthened in tandem.
Meanwhile, the market expects Intel and SK Hynix (SKHY) to advance cooperation on U.S. domestic memory chip manufacturing, but discussions remain in an exploratory stage and no agreement has been reached.
Intel Product Business Improves as AI Inference Demand Heats Up
Following Meta's release of Muse, market attention has focused on the demand for server CPUs driven by AI agents. CPUs work alongside GPUs and other accelerators in inference, task scheduling, and data processing, sending shares of Intel, AMD, and Arm higher.
Intel's second-quarter revenue rose 25% year-over-year to $16.1 billion, with Data Center and AI segment revenue growing 59% to $6.3 billion, and Non-GAAP EPS coming in at $0.42. The company expects third-quarter revenue of $15.8 billion to $16.8 billion and a Non-GAAP gross margin of approximately 42%.
In manufacturing, Intel's cumulative High-NA EUV wafer processing volume has exceeded 1 million wafers, covering tool qualification, R&D, and production. The company has applied High-NA EUV to Intel 18A process layers for select Panther Lake processors and entered high-volume manufacturing. External customer order scale and volume production progress will impact revenue growth in the foundry business.
SK Hynix Partnership Holds Potential but Remains in Preliminary Discussions
According to Reuters, SK Hynix is in discussions with Intel to produce memory chips in the United States, with options including leasing space at Intel's under-construction Ohio facility, or forming a joint venture with Intel and major cloud service providers.
If the cooperation comes to fruition, Intel is expected to boost future capacity utilization for its Ohio project and ease some of its construction funding pressures.
The two sides are still in preliminary discussions and have not reached an agreement. If the cooperation involves HBM, DRAM, or other South Korean "national core technologies," the relevant technology transfer would be subject to review by the South Korean government.
In addition, equity dilution is another risk facing Intel. In August, Intel issued approximately 211 million shares at $95 per share, raising a total of $20 billion with expected net proceeds of about $19.7 billion, while underwriters have an option to purchase up to an additional 31.58 million shares. The raised funds will be used for general corporate purposes, including capital expenditures and working capital.
This financing enhanced Intel's capital reserves while expanding its floating share capital. Subsequent returns on investment will depend on the mass production of advanced process nodes, orders from external customers, and the utilization of newly built capacity.
INTC Technical Analysis: $125 Is Short-Term Breakout Level, Focus on $135 After Holding Firm
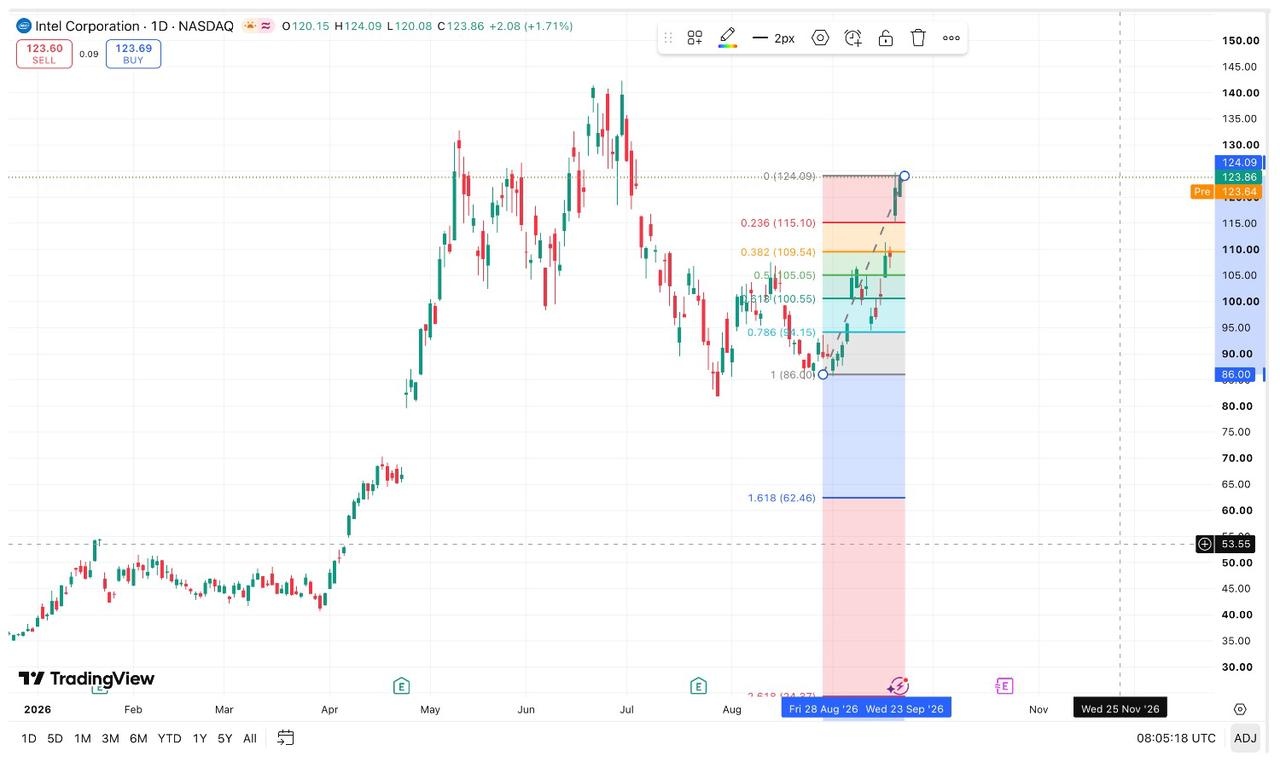
[Source: TradingView]
On the daily chart, Intel's stock price rebounded from around $86 at the end of August to $123.86, reaching an intraday high of $124.09. It is currently testing the $124–$125 resistance zone.
Using the rally from the low of around $86 to the high of $124.09 as the Fibonacci measurement interval, key retracement support levels are located at:
- 0.236 retracement level: around $115.10
- 0.382 retracement level: around $109.54
- 0.500 retracement level: around $105.05
- 0.618 retracement level: around $100.55
- 0.786 retracement level: around $94.15
If the stock price holds firmly above $125 at the close, the next resistance level is seen at $130, followed by $134–$135. A further breakout could test the previous high of $140–$142. The 1.618 Fibonacci extension level is around $147.63.
On the downside, $120 serves as short-term support, with the 0.236 Fibonacci retracement level at around $115.10. If it falls below $115, the next support levels are sequentially located at $109–$110 and $104–$105; if $100 fails to hold, the stock price may pull back to $94–$95.
Overall, holding firmly above $125 will open up upside room toward $134–$142; if it breaks below $115, the current rebound structure will weaken.
Nothing in this material constitutes investment advice, personal recommendation, investment research, an offer, or a solicitation to buy or sell any financial instrument. The content has been prepared without consideration of your individual investment objectives, financial situation, or needs, and should not be treated as such.
Past performance is not a reliable indicator of future performance and/or results. Forward-looking scenarios or forecasts are not a guarantee of future performance. Actual results may differ materially from those anticipated.
Mitrade makes no representation or warranty as to the accuracy or completeness of the information provided and accepts no liability for any loss arising from reliance on such information.
Recommended Articles


