



Novo Nordisk A/S Stock (NVO) Closed Down by 3.12% on Sep 23: Key Drivers Unveiled
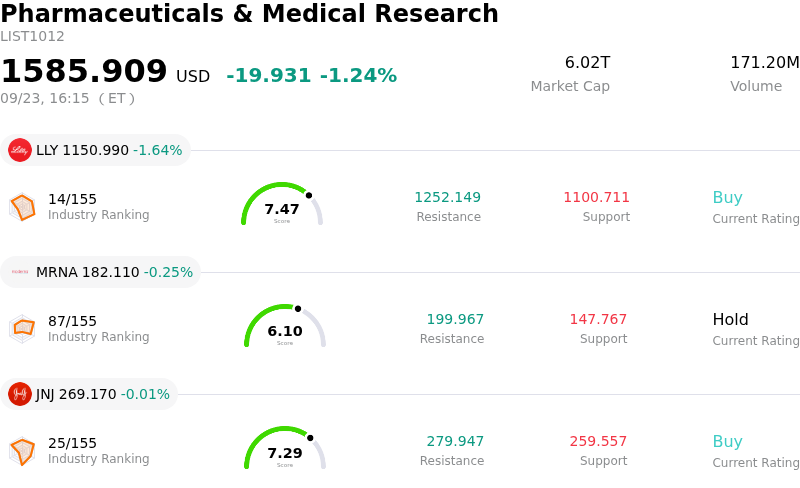
Novo Nordisk A/S (NVO) closed down by 3.12%. The Pharmaceuticals & Medical Research sector is down by 1.24%. The company underperformed the industry. Top 3 stocks by turnover in the sector: Eli Lilly and Co (LLY) down 1.64%; Moderna Inc (MRNA) down 0.25%; Johnson & Johnson (JNJ) down 0.01%.
What is driving Novo Nordisk A/S (NVO)’s stock price down today?
Novo Nordisk experienced notable intraday volatility and downward pressure as market participants continued to digest updates from the company's recent Capital Markets Day in London. Investor disappointment was primarily triggered by management's long-term financial targets, which forecasted compound annual revenue growth from 2026 through 2030 to be merely in line with broader pharmaceutical industry peers. This projected growth trajectory reflects a pronounced deceleration from the double-digit expansion rates achieved in prior years, raising concerns that the high-growth phase driven by its flagship metabolic treatments is moderating faster than expected.
Compounding the negative sentiment are structural market headwinds and intensifying competitive dynamics. Market share erosion in the weight-loss and diabetes categories to key rivals, alongside emerging clinical developments from next-generation biotechs, has heightened concern over Novo Nordisk's long-term dominance. Furthermore, management explicitly detailed risks surrounding the upcoming semaglutide patent cliff set for the early 2030s. While recent cost-cutting measures and organizational restructuring aim to protect operational margins, near-term projections reflecting revenue contractions for the year have left institutional investors hesitant to maintain elevated valuation multiples.
Despite the near-term headwinds, the company emphasized strategic investments intended to build its post-semaglutide pipeline, including late-stage clinical programs like CagriSema and expanded distribution of oral GLP-1 therapies. Management also reiterated goals to launch multiple blockbuster therapeutics by the end of the decade and generate substantial risk-adjusted sales from pipeline assets by 2035. However, until Novo Nordisk demonstrates tangible execution in regaining commercial momentum and successfully offsetting competitive pressures, market sentiment is likely to remain constrained, keeping trading activity volatile.
Technical Analysis of Novo Nordisk A/S (NVO)
Technically, Novo Nordisk A/S (NVO) shows a MACD (12,26,9) value of -1.237, indicating a sell signal. The RSI at 27.877 suggests sell condition and the Williams %R at 100.000 suggests oversold condition. Please monitor closely.
Fundamental Analysis of Novo Nordisk A/S (NVO)
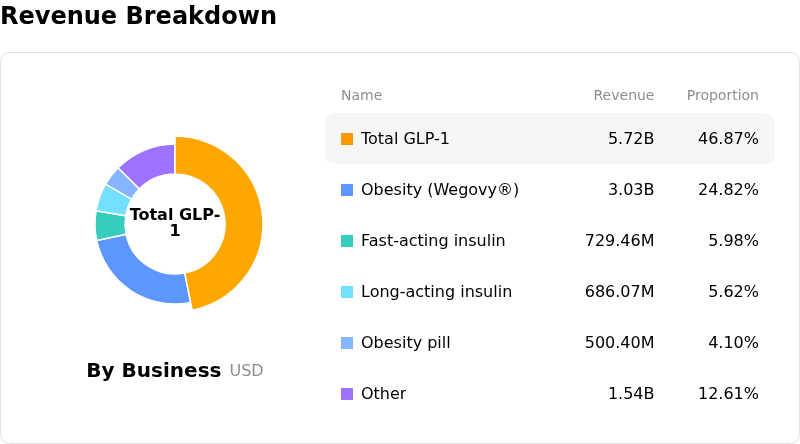
Novo Nordisk A/S (NVO) is in the Pharmaceuticals & Medical Research industry. Its latest annual revenue is $46.70B, ranking 12 in the industry. The net profit is $15.48B, ranking 4 in the industry. Company Profile
Over the past month, multiple analysts have rated the company as Hold, with an average price target of $49.11, a high of $65.00, and a low of $40.00.
More details about Novo Nordisk A/S (NVO)
Company Specific Risks:
- Underwhelming Growth Guidance at Capital Markets Day: Novo Nordisk shares experienced steep selling pressure following its London Capital Markets Day presentation, where management disclosed that 2026–2030 revenue growth is projected to decelerate to match average pharmaceutical industry peers, failing to offer concrete near-term catalysts to re-accelerate top-line expansion.
- Accelerating Market Share Erosion to Key Competitors: Institutional analyst commentary and market surveys indicate ongoing market share losses in core GLP-1 diabetes and weight-loss franchises to Eli Lilly's expanding portfolio, raising institutional concerns over long-term pricing power and volume dominance.
- Severe Revenue Concentration Ahead of Patent Expirations: With semaglutide products (Wegovy and Ozempic) generating approximately 75% of overall sales, the company faces major revenue sustainability risks as key international patents begin expiring in the early 2030s without fully offsetting commercial assets.
- Pipeline Setbacks in Non-Obesity Diversification: Recent late-stage trial failures in cardiorenal drug candidates, including the halted Phase 3 studies for ziltivekimab, have heightened execution risks and left the drugmaker heavily reliant on its core obesity and diabetes treatments.
Nothing in this material constitutes investment advice, personal recommendation, investment research, an offer, or a solicitation to buy or sell any financial instrument. The content has been prepared without consideration of your individual investment objectives, financial situation, or needs, and should not be treated as such.
Past performance is not a reliable indicator of future performance and/or results. Forward-looking scenarios or forecasts are not a guarantee of future performance. Actual results may differ materially from those anticipated.
Mitrade makes no representation or warranty as to the accuracy or completeness of the information provided and accepts no liability for any loss arising from reliance on such information.
Recommended Articles


