



Arm Holdings PLC Stock (ARM) Moved Down by 6.69% on Oct 22: Facts Behind the Movement
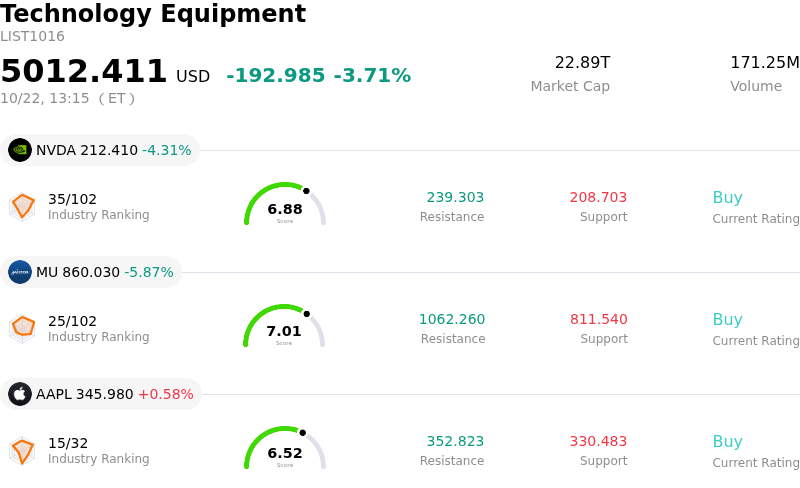
Arm Holdings PLC (ARM) moved down by 6.69%. The Technology Equipment sector is down by 3.71%. The company underperformed the industry. Top 3 stocks by turnover in the sector: NVIDIA Corp (NVDA) down 4.22%; Micron Technology Inc (MU) down 5.87%; Apple Inc (AAPL) up 0.58%.
What is driving Arm Holdings PLC (ARM)’s stock price down today?
Arm Holdings experienced notable downward pressure and heightened intraday volatility as a broader selloff in semiconductor and artificial intelligence equities dragged high-valuation technology names lower. Market sentiment turned risk-off following concerns surrounding heavy AI infrastructure capital expenditures across major technology hyperscalers, alongside negative read-throughs from equipment suppliers in the chip ecosystem. Given Arm's significant valuation premium relative to legacy semiconductor peers, the stock remains particularly sensitive to sector-wide multiple compression and institutional profit-taking following its substantial year-to-date advance.
Company-specific headwinds continue to compound the pressure, dominated by lingering uncertainty around its ongoing architectural licensing dispute. A recent adverse court verdict involving Qualcomm has amplified institutional concerns over potential royalty payment disruptions, contractual enforcement risks, and ecosystem friction with key licensing partners. For a business model heavily dependent on high-margin licensing fees and scalable IP royalties across smartphones and data center central processing units, ongoing legal complications create an unwelcome overhang on revenue predictability.
Derivatives positioning further catalyzed the intraday decline as institutional investors actively increased defensive put option volume and implied volatility to hedge downside exposure ahead of the company's upcoming quarterly earnings announcement. With valuation multiples remaining stretched, market participants are demanding pristine execution across data center expansion and agentic AI processor adoption. Until legal clarity emerges and upcoming earnings validate royalty growth momentum, short-term price action in Arm is likely to remain constrained by heightened volatility and headline sensitivity.
Technical Analysis of Arm Holdings PLC (ARM)
Technically, Arm Holdings PLC (ARM) shows a MACD (12,26,9) value of -15.032, indicating a sell signal. The RSI at 31.745 suggests neutral condition and the Williams %R at 97.981 suggests oversold condition. Please monitor closely.
Fundamental Analysis of Arm Holdings PLC (ARM)
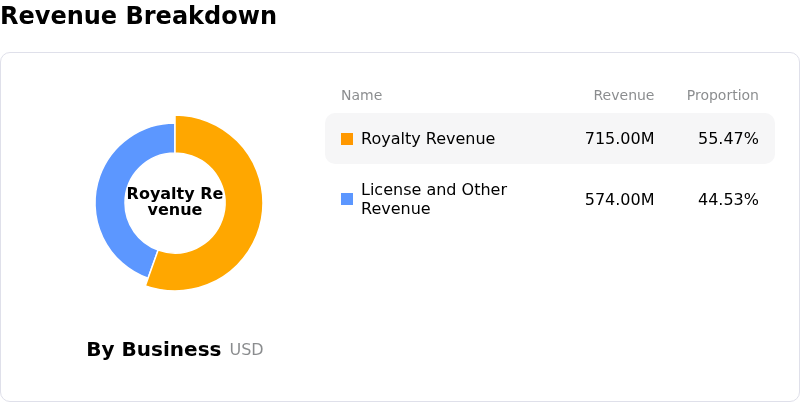
Arm Holdings PLC (ARM) is in the Technology Equipment industry. Its latest annual revenue is $4.92B, ranking 24 in the industry. The net profit is $904.00M, ranking 18 in the industry. Company Profile
Over the past month, multiple analysts have rated the company as Buy, with an average price target of $286.95, a high of $480.00, and a low of $125.00.
More details about Arm Holdings PLC (ARM)
Company Specific Risks:
- Legal and Licensing Dispute Exposure: An adverse federal court jury ruling in the architectural licensing dispute with Qualcomm has escalated legal uncertainties, raising institutional concerns regarding potential royalty payment suspensions and friction across core customer relationships.
- Pre-Earnings Derivatives Hedging Pressure: Institutional options traders have sharply increased bearish positioning ahead of the upcoming earnings report, driving the put/call ratio up to 1.18 and elevating implied volatility to over 75%, aggravating intraday price swings.
- Extreme Valuation Vulnerability: Trading at a trailing P/E multiple exceeding 200x, Arm offers negligible margin for error, leaving the stock highly susceptible to profit-taking and multiple compression during semiconductor sector pullbacks.
- Persistent Insider Selling: Disclosures indicating substantial executive insider liquidations totaling over $70 million over the past year—with zero insider purchases—continue to undermine investor confidence during technical sell-offs.
Nothing in this material constitutes investment advice, personal recommendation, investment research, an offer, or a solicitation to buy or sell any financial instrument. The content has been prepared without consideration of your individual investment objectives, financial situation, or needs, and should not be treated as such.
Past performance is not a reliable indicator of future performance and/or results. Forward-looking scenarios or forecasts are not a guarantee of future performance. Actual results may differ materially from those anticipated.
Mitrade makes no representation or warranty as to the accuracy or completeness of the information provided and accepts no liability for any loss arising from reliance on such information.
Recommended Articles


