



Merck & Co Inc Stock (MRK) Moved Down by 3.28% on Oct 22: A Full Analysis
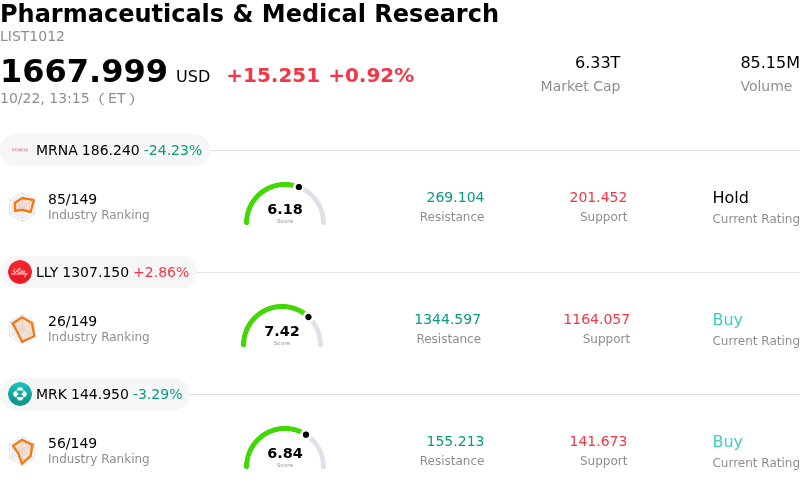
Merck & Co Inc (MRK) moved down by 3.28%. The Pharmaceuticals & Medical Research sector is up by 0.92%. The company underperformed the industry. Top 3 stocks by turnover in the sector: Moderna Inc (MRNA) down 24.23%; Eli Lilly and Co (LLY) up 2.86%; Merck & Co Inc (MRK) down 3.29%.
What is driving Merck & Co Inc (MRK)’s stock price down today?
Merck experienced downward pressure as investors took profits following a strong multi-month rally that brought the stock near its 52-week peak. The decline was primarily driven by prominent analyst downgrades, pre-earnings positioning, and renewed caution regarding the company's growth trajectory ahead of its upcoming quarterly financial report.
Fundamental sentiment shifted after research analysts lowered their outlook on the stock, citing potential short-term earnings headwinds and elevated valuation risks. Market participants expressed concern over the upcoming quarterly results, which face challenging year-over-year comparisons due to prior-year wholesaler inventory timing benefits that will not recur. Furthermore, long-term structural anxieties persist regarding Keytruda's eventual patent expiration, moderating domestic sales growth, and legal disputes over subcutaneous formulations, placing heightened pressure on newer commercial drugs and pipeline candidates to bridge future revenue gaps.
Recent corporate insider transactions and negative short-term earnings surprise indicators further dampened institutional risk appetite. Despite positive clinical pipeline developments and regulatory progress in international markets, market sentiment turned defensive as traders rebalanced positions to manage volatility in advance of the scheduled earnings call.
Technical Analysis of Merck & Co Inc (MRK)
Technically, Merck & Co Inc (MRK) shows a MACD (12,26,9) value of 0.473, indicating a buy signal. The RSI at 50.217 suggests neutral condition and the Williams %R at 55.987 suggests sell condition. Please monitor closely.
Fundamental Analysis of Merck & Co Inc (MRK)
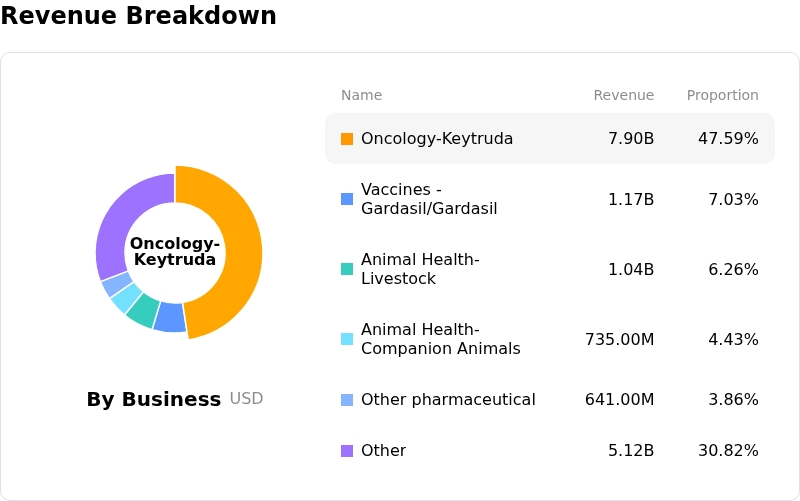
Merck & Co Inc (MRK) is in the Pharmaceuticals & Medical Research industry. Its latest annual revenue is $65.01B, ranking 5 in the industry. The net profit is $18.25B, ranking 3 in the industry. Company Profile
Over the past month, multiple analysts have rated the company as Buy, with an average price target of $154.78, a high of $186.00, and a low of $105.00.
More details about Merck & Co Inc (MRK)
Company Specific Risks:
- Analyst Downgrades and Bearish Earnings Expectations: Zacks Research downgraded Merck to a "Strong Sell" with a negative Earnings ESP of -0.99%, while Goldman Sachs trimmed its price target to $155 due to rising operational and R&D expenditures, reflecting institutional anxiety over projected year-over-year earnings contractions ahead of the Q3 earnings release.
- Keytruda Patent Exclusivity and European Legal Challenges: Heavy commercial reliance on the Keytruda franchise creates structural top-line vulnerabilities as U.S. penetration nears peak levels ahead of approaching loss-of-exclusivity deadlines, compounded by legal setbacks impacting subcutaneous Keytruda commercialization in select European jurisdictions.
- Gardasil Revenue Weakness in Asian Markets: Softened demand and significant sales drops for the Gardasil vaccine franchise across key international regions, notably China and Japan, continue to impose headwinds on non-oncology pharmaceutical revenue streams.
- Oncology Pipeline Failures and Acquisition Expense Drag: Recent Phase 3 clinical trial discontinuations in major oncology combination programs heighten market anxiety over long-term growth continuity, while substantial upfront charges for in-process R&D and acquisitions continue to compress net profit margins and impair EPS guidance.
Nothing in this material constitutes investment advice, personal recommendation, investment research, an offer, or a solicitation to buy or sell any financial instrument. The content has been prepared without consideration of your individual investment objectives, financial situation, or needs, and should not be treated as such.
Past performance is not a reliable indicator of future performance and/or results. Forward-looking scenarios or forecasts are not a guarantee of future performance. Actual results may differ materially from those anticipated.
Mitrade makes no representation or warranty as to the accuracy or completeness of the information provided and accepts no liability for any loss arising from reliance on such information.
Recommended Articles


