

GBP/USD surges as BoE holds rates, hints inflation risks remain
- GBP/USD surges 0.76% to 1.3356 after BoE keeps rates at 3.75%.
- BoE warns inflation could hit 3.5%, citing Middle East-driven price pressures.
- DXY drops to 99.70 as falling Oil prices weigh on the US Dollar.
The GBP/USD surges during the North American session after the Bank of England held rates unchanged, citing high inflationary pressures spurred by the Middle East conflict. The pair trades at 1.3356, up 0.76%.
Sterling rallies as Bank of England pushes back on easing despite global uncertainty
The BoE opted to keep the Bank Rate at 3.75% because the Monetary Policy Committee (MPC) expects inflation to reach 3.5% over the next two quarters, according to the BoE staff. The central bank acknowledged that although an economic slowdown could push inflationary pressures lower, it noted that the biggest risk is inflation.
BoE Governor Andrew Bailey commented that money markets get ahead of themselves and said that they—the BoE —sent a very clear message that the “right place to be is on hold.”
In the US, Initial Jobless Claims for the week ending March 14 dipped from 213K to 205K, below estimates of a rise to 215K, as revealed by the US Department of Labor. Despite this, the Greenback remains pressured due to its close correlation with the US Crude Oil benchmark, Western Texas Intermediate (WTI).
The US Dollar Index (DXY), which measures the performance of the buck’s value against six currencies, loses 0.56%, down to 99.70 after clearing $100.00 earlier. WTI is also falling some 2.54%, down to $96.43.
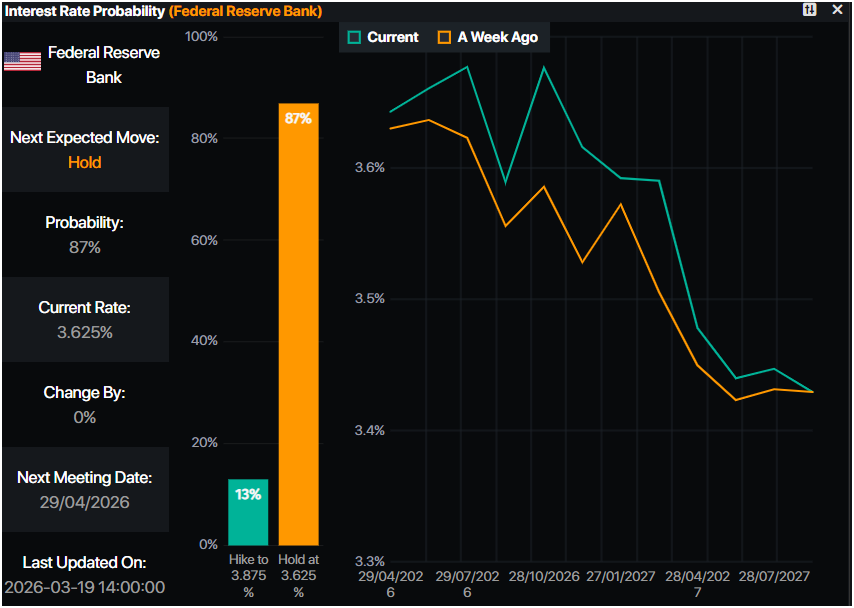
On Wednesday, the Federal Reserve decided to keep rates unchanged while setting a higher bar for rate cuts, as Fed Chair Jerome Powell stated. He said that goods inflation is what they’re looking for to ease policy.
Money markets do not expect a Fed rate cut in 2026, with the first move expected in the first half of 2027, according to Prime Market Terminal data.
Next week, the UK economic docket will feature S&P Global Flash PMIs. In the US, traders will eye PMIs and jobs data.
GBP/USD Price Forecast: Technical outlook
In the daily chart, GBP/USD trades at 1.3356. The pair sits just below the cluster of the 50–200-day simple moving averages around 1.35, while price action is compressing between the rising support trend line from 1.3035 and the descending resistance trend line from 1.3869, leaving a mildly bearish near-term bias within a broader consolidation. The latest candles show repeated failures near the descending trend line, confirming it as the primary cap on rebounds, and the inability to reclaim the moving-average area suggests sellers retain the upper hand despite the still-intact longer-term uptrend line.
Initial resistance is now at the descending trend line intersecting near 1.3435, followed by the moving-average band around 1.3500, where a daily close above would soften the bearish tone and open room toward the mid-1.36 region. On the downside, immediate support is seen around 1.3320, with stronger backing at the rising trend line currently coming in near 1.3250, where a break would signal a more decisive shift lower toward the 1.32 area and expose the 1.30 handle next.
(The technical analysis of this story was written with the help of an AI tool.)
Pound Sterling Price This week
The table below shows the percentage change of British Pound (GBP) against listed major currencies this week. British Pound was the strongest against the Swiss Franc.
| USD | EUR | GBP | JPY | CAD | AUD | NZD | CHF | |
|---|---|---|---|---|---|---|---|---|
| USD | -0.74% | -0.86% | -0.67% | 0.03% | -0.56% | -0.63% | 0.18% | |
| EUR | 0.74% | -0.10% | 0.00% | 0.77% | 0.19% | 0.11% | 0.92% | |
| GBP | 0.86% | 0.10% | 0.23% | 0.87% | 0.30% | 0.21% | 1.09% | |
| JPY | 0.67% | 0.00% | -0.23% | 0.71% | 0.11% | 0.06% | 0.85% | |
| CAD | -0.03% | -0.77% | -0.87% | -0.71% | -0.62% | -0.64% | 0.16% | |
| AUD | 0.56% | -0.19% | -0.30% | -0.11% | 0.62% | -0.08% | 0.74% | |
| NZD | 0.63% | -0.11% | -0.21% | -0.06% | 0.64% | 0.08% | 0.78% | |
| CHF | -0.18% | -0.92% | -1.09% | -0.85% | -0.16% | -0.74% | -0.78% |
The heat map shows percentage changes of major currencies against each other. The base currency is picked from the left column, while the quote currency is picked from the top row. For example, if you pick the British Pound from the left column and move along the horizontal line to the US Dollar, the percentage change displayed in the box will represent GBP (base)/USD (quote).
Nothing in this material constitutes investment advice, personal recommendation, investment research, an offer, or a solicitation to buy or sell any financial instrument. The content has been prepared without consideration of your individual investment objectives, financial situation, or needs, and should not be treated as such.
Past performance is not a reliable indicator of future performance and/or results. Forward-looking scenarios or forecasts are not a guarantee of future performance. Actual results may differ materially from those anticipated.
Mitrade makes no representation or warranty as to the accuracy or completeness of the information provided and accepts no liability for any loss arising from reliance on such information.
Recommended Articles


