

Silver Price Forecast: XAG bearish below 200-day SMA, eyes on $61.50
- Silver remains below 200-day SMA, keeping bearish structure intact.
- RSI stays bearish, confirming sellers retain near-term momentum control.
- Break below $65.77 exposes $63.32 and $61.50 supports.
Silver price retreats on Thursday by nearly 2%, as the Greenback refreshes year-to-date (YTD) highs, spurred by the Federal Reserve's hawkish tilt, with nearly half of the board members supporting rate hikes in 2026. The XAG/USD trades at $66.07, after diving from daily highs of $69.85.
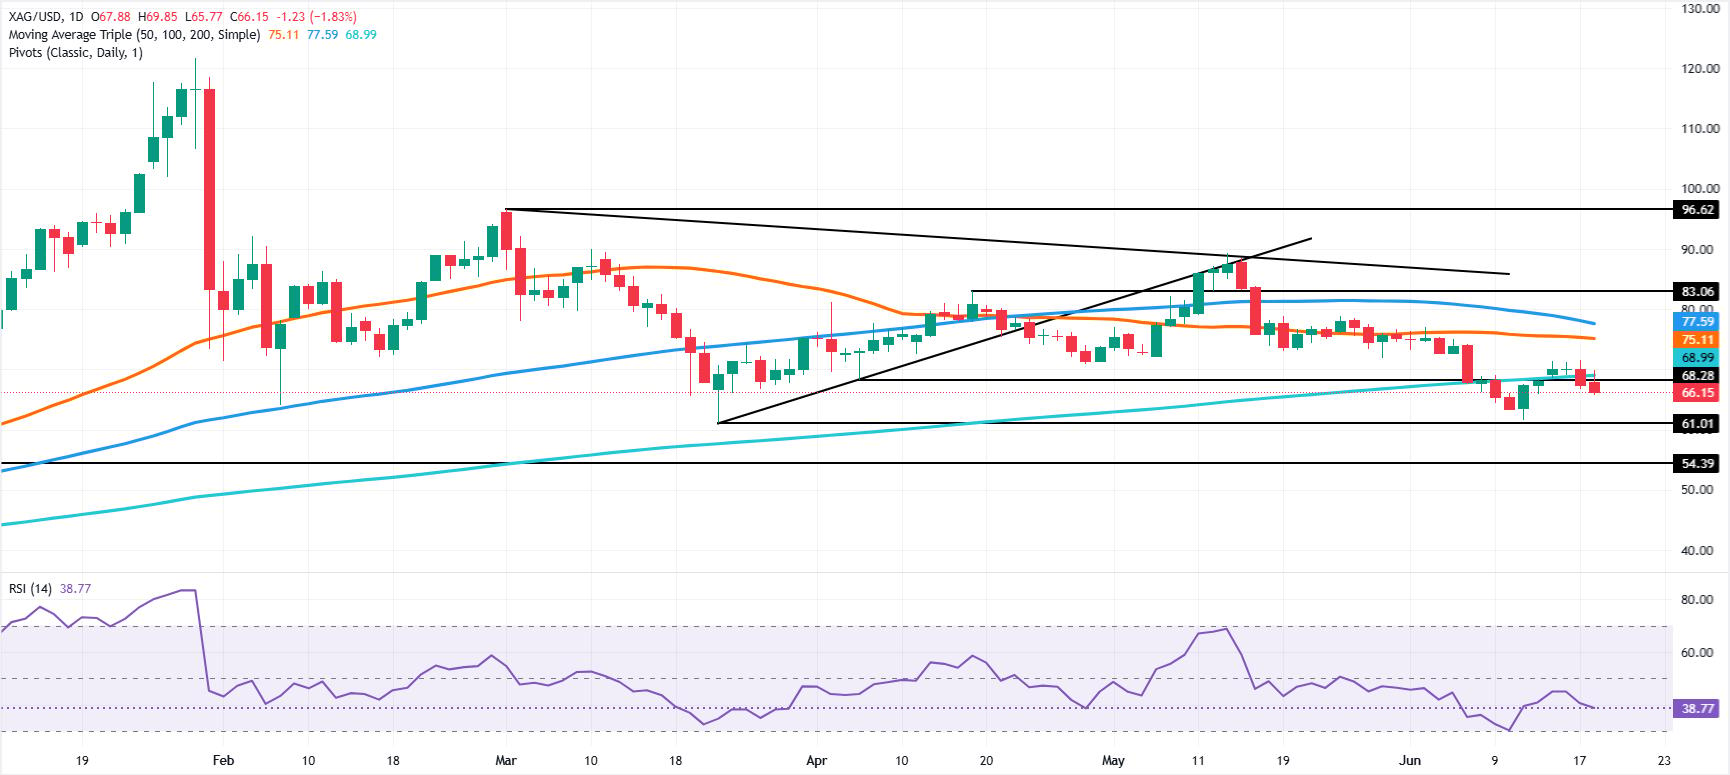
XAG/USD Price Forecast: Technical outlook
After clearing the 200-day Simple Moving Average (SMA) at $68.99, the white metal extended its losses to $61.50 before recovering some ground, but sellers ultimately drove XAG to $65.77.
The Relative Strength Index (RSI) is bearish, an indication that sellers are in charge and that further Silver’s downside is expected.
If XAG/USD dives below $66.00, it opens the door to test the June 18 daily low of $65.77. On further weakness, the next support would be the June 10 daily low of $63.32, ahead of the June 11 cycle low of 61.50.
However, if buyers move in, they must clear the $68.00 figure, so that they can challenge the 200-day SMA. Once hurdled, the next stop would be the psychological $70.00 milestone, ahead of the 50-day SMA at $75.00.
XAG/USD Price Chart – Daily
Silver FAQs
Silver is a precious metal highly traded among investors. It has been historically used as a store of value and a medium of exchange. Although less popular than Gold, traders may turn to Silver to diversify their investment portfolio, for its intrinsic value or as a potential hedge during high-inflation periods. Investors can buy physical Silver, in coins or in bars, or trade it through vehicles such as Exchange Traded Funds, which track its price on international markets.
Silver prices can move due to a wide range of factors. Geopolitical instability or fears of a deep recession can make Silver price escalate due to its safe-haven status, although to a lesser extent than Gold's. As a yieldless asset, Silver tends to rise with lower interest rates. Its moves also depend on how the US Dollar (USD) behaves as the asset is priced in dollars (XAG/USD). A strong Dollar tends to keep the price of Silver at bay, whereas a weaker Dollar is likely to propel prices up. Other factors such as investment demand, mining supply – Silver is much more abundant than Gold – and recycling rates can also affect prices.
Silver is widely used in industry, particularly in sectors such as electronics or solar energy, as it has one of the highest electric conductivity of all metals – more than Copper and Gold. A surge in demand can increase prices, while a decline tends to lower them. Dynamics in the US, Chinese and Indian economies can also contribute to price swings: for the US and particularly China, their big industrial sectors use Silver in various processes; in India, consumers’ demand for the precious metal for jewellery also plays a key role in setting prices.
Silver prices tend to follow Gold's moves. When Gold prices rise, Silver typically follows suit, as their status as safe-haven assets is similar. The Gold/Silver ratio, which shows the number of ounces of Silver needed to equal the value of one ounce of Gold, may help to determine the relative valuation between both metals. Some investors may consider a high ratio as an indicator that Silver is undervalued, or Gold is overvalued. On the contrary, a low ratio might suggest that Gold is undervalued relative to Silver.
Nothing in this material constitutes investment advice, personal recommendation, investment research, an offer, or a solicitation to buy or sell any financial instrument. The content has been prepared without consideration of your individual investment objectives, financial situation, or needs, and should not be treated as such.
Past performance is not a reliable indicator of future performance and/or results. Forward-looking scenarios or forecasts are not a guarantee of future performance. Actual results may differ materially from those anticipated.
Mitrade makes no representation or warranty as to the accuracy or completeness of the information provided and accepts no liability for any loss arising from reliance on such information.
Recommended Articles


