CFDs are complex instruments and come with a high risk of losing money rapidly due to leverage. 78% of retail investor accounts lose money when trading CFDs with this provider. You should consider whether you understand how CFDs work and whether you can afford to take the high risk of losing your money.

USD/CHF Price Forecast: Hits new YTD high, past 0.8050

Source Fxstreet
  • USD/CHF clears previous YTD high, confirming bullish continuation structure.
  • RSI breaks latest peak, signaling buyers are gaining momentum.
  • Break above 0.8100 exposes 0.8124 and 0.8171 resistance.

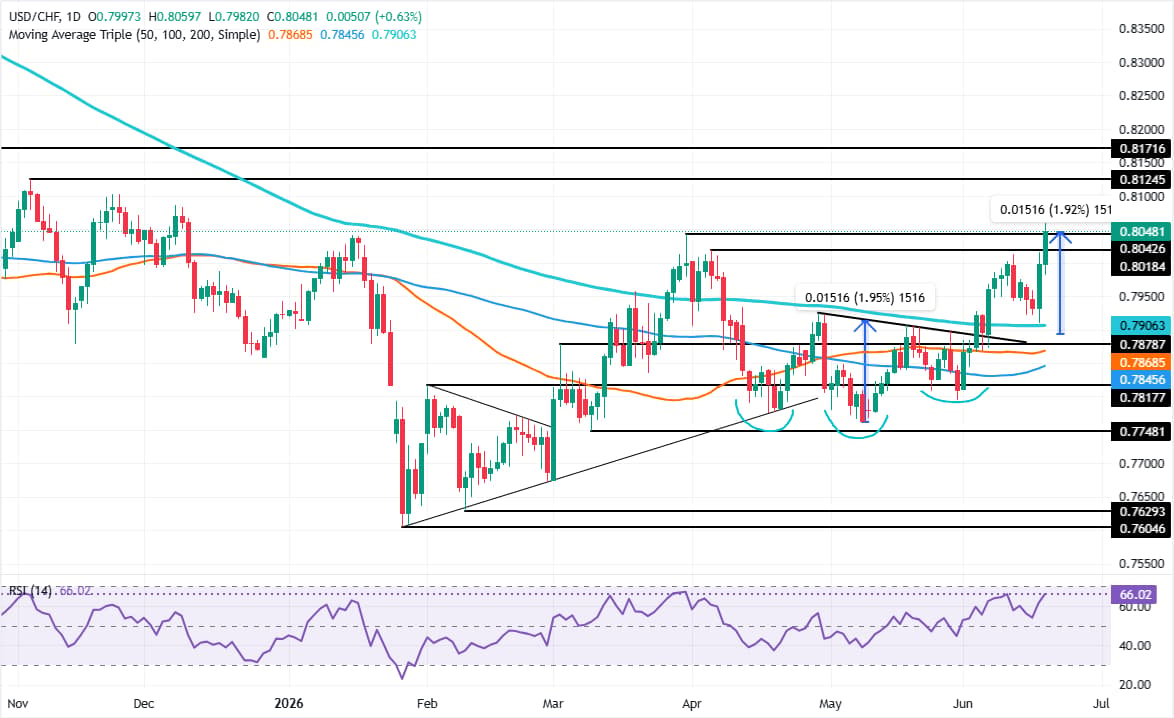
The USD/CHF rallies to a new yearly high of 0.8059, surpassing March’s 31 previous peak of 2026 at 0.8042 as the Greenback stages a recovery due to hawkish Fed policy expectations, which drove the pair to reach the ‘inverted head-and-shoulders,’ price target.

USD/CHF Price Forecast: Technical outlook

Price action shows the pair is upwardly biased after clearing its previous yearly peak. USD/JPY buyers are shifting towards challenging the 0.8100 milestone, ahead of the November 2025 peak of 0.8124.

The Relative Strength Index (RSI) cleared its latest peak, signalling that buyers are gaining momentum.

Therefore, if USD/CHF clears 0.8100, the 0.8124 high is up next. Once breached, the next area of interest would be the August 2025 high at 0.8171, before buyers test the 0.8200 figure.

On the downside, the USD/CHF first support would be June’s 17 high, turned support at 0.8015. Once cleared, 0.8000 is up next, followed by the 200-day SMA at 0.7906.

USD/CHF Price Chart – Daily

USD/CHF daily chart

Swiss Franc Price Today

The table below shows the percentage change of Swiss Franc (CHF) against listed major currencies today. Swiss Franc was the strongest against the British Pound.

USD EUR GBP JPY CAD AUD NZD CHF
USD 0.36% 0.65% 0.40% 0.21% -0.04% 0.27% 0.65%
EUR -0.36% 0.30% 0.07% -0.15% -0.41% -0.14% 0.29%
GBP -0.65% -0.30% -0.26% -0.45% -0.69% -0.43% -0.03%
JPY -0.40% -0.07% 0.26% -0.19% -0.47% -0.20% 0.21%
CAD -0.21% 0.15% 0.45% 0.19% -0.28% -0.00% 0.42%
AUD 0.04% 0.41% 0.69% 0.47% 0.28% 0.27% 0.71%
NZD -0.27% 0.14% 0.43% 0.20% 0.00% -0.27% 0.43%
CHF -0.65% -0.29% 0.03% -0.21% -0.42% -0.71% -0.43%

The heat map shows percentage changes of major currencies against each other. The base currency is picked from the left column, while the quote currency is picked from the top row. For example, if you pick the Swiss Franc from the left column and move along the horizontal line to the US Dollar, the percentage change displayed in the box will represent CHF (base)/USD (quote).

Disclaimer: The content available on Mitrade Insights is provided for informational and marketing purposes only. It has not been prepared in accordance with legal requirements designed to promote the independence of investment research and is not subject to any prohibition on dealing ahead of the dissemination of investment research
Nothing in this material constitutes investment advice, personal recommendation, investment research, an offer, or a solicitation to buy or sell any financial instrument. The content has been prepared without consideration of your individual investment objectives, financial situation, or needs, and should not be treated as such.
Past performance is not a reliable indicator of future performance and/or results. Forward-looking scenarios or forecasts are not a guarantee of future performance. Actual results may differ materially from those anticipated.
Mitrade makes no representation or warranty as to the accuracy or completeness of the information provided and accepts no liability for any loss arising from reliance on such information.
placeholder
The Trumponomics Ebook: Oil Price Volatility in the Iran War Understand how the Strait of Hormuz shock moved markets, and what CFD traders watched next.
Author  Rachel Weiss
May 25, Mon
Understand how the Strait of Hormuz shock moved markets, and what CFD traders watched next.
placeholder
Financial Markets 2026: Volatility Catalysts in Gold, Silver, Oil, and Blue-Chip Stocks—A CFD Trader's OutlookThe financial world is perpetually in motion, but the landscape for 2026 seems to be shaping up to be particularly dynamic. For CFD traders navigating global markets, this heightened volatility could present a distinctive set of challenges and opportunities.
Author  Rachel Weiss
May 18, Mon
The financial world is perpetually in motion, but the landscape for 2026 seems to be shaping up to be particularly dynamic. For CFD traders navigating global markets, this heightened volatility could present a distinctive set of challenges and opportunities.
placeholder
Japan's Nikkei closes at record high as tech earnings overshadow Mideast concernsBy Rocky Swift TOKYO, April 24 (Reuters) - Japan's Nikkei set a closing record high on Friday, capping a third consecutive weekly gain, as enthusiasm over technology sector earnings offset uncertainty over a potential peace deal in the Middle East.The benchmark Nikkei 225 Index .N225 rose 0.9...
Author  Reuters
Apr 24, Fri
By Rocky Swift TOKYO, April 24 (Reuters) - Japan's Nikkei set a closing record high on Friday, capping a third consecutive weekly gain, as enthusiasm over technology sector earnings offset uncertainty over a potential peace deal in the Middle East.The benchmark Nikkei 225 Index .N225 rose 0.9...
placeholder
Euro zone short-dated yields set for weekly rise on Hormuz concernsBy Stefano Rebaudo April 24 (Reuters) - Euro zone short-dated government bond yields were headed for their biggest weekly rise in over a month as tensions around the Strait of Hormuz stoked inflation fears and European Central Bank rate hike expectations.Borrowing costs tracked oil prices, which ...
Author  Reuters
Apr 24, Fri
By Stefano Rebaudo April 24 (Reuters) - Euro zone short-dated government bond yields were headed for their biggest weekly rise in over a month as tensions around the Strait of Hormuz stoked inflation fears and European Central Bank rate hike expectations.Borrowing costs tracked oil prices, which ...
placeholder
USD: Liquidity backstops and war pressures – CommerzbankCommerzbank’s Michael Pfister discusses how US allies in Middle East and Asia are seeking Dollar swap lines as conflicts curb energy exports and tourism.
Author  Reuters
Apr 24, Fri
Commerzbank’s Michael Pfister discusses how US allies in Middle East and Asia are seeking Dollar swap lines as conflicts curb energy exports and tourism.
Related Instrument
goTop
quote