



USD/CAD Price Forecast: Lower oil prices ensure further weakness for Canadian Dollar
- USD/CAD drops to near 1.4113 despite falling oil prices.
- The US Dollar is expected to trade sideways as the Fed’s policy takes center stage.
- US President Trump urges the Fed to cut interest rates.
The USD/CAD pair trades marginally lower to near 1.4113 during the European trading session on Tuesday. The Loonie pair edges down as the Canadian Dollar (CAD) outperforms its major currency peers. However, the strength is expected to be temporary, as oil prices have declined further due to continued negotiations between the United States (US) and Iran to adhere to the peace agreement after recent violations.
In European trade, the WTI Oil price posts a fresh weekly low, trading 2.2% lower to near $79.40. Currencies from economies, such as Canada, which are net energy exporters, tend to lose their appeal when oil prices start declining.
Meanwhile, the US Dollar trades flat after a strong Monday, awaiting the Federal Reserve’s (Fed) monetary policy announcement on Wednesday. According to the CME FedWatch tool, traders see a 62% chance that the Fed will leave interest rates unchanged in the range of 3.50%-3.75%.
On Monday, US President Donald Trump urged Fed Chairman Kevin Warsh to cut interest rates in the Wednesday meeting. To support his view, Trump said that there was a good inflation report recently, costs were falling rapidly, and that prices should drop significantly once the Gulf War ends.
USD/CAD technical analysis
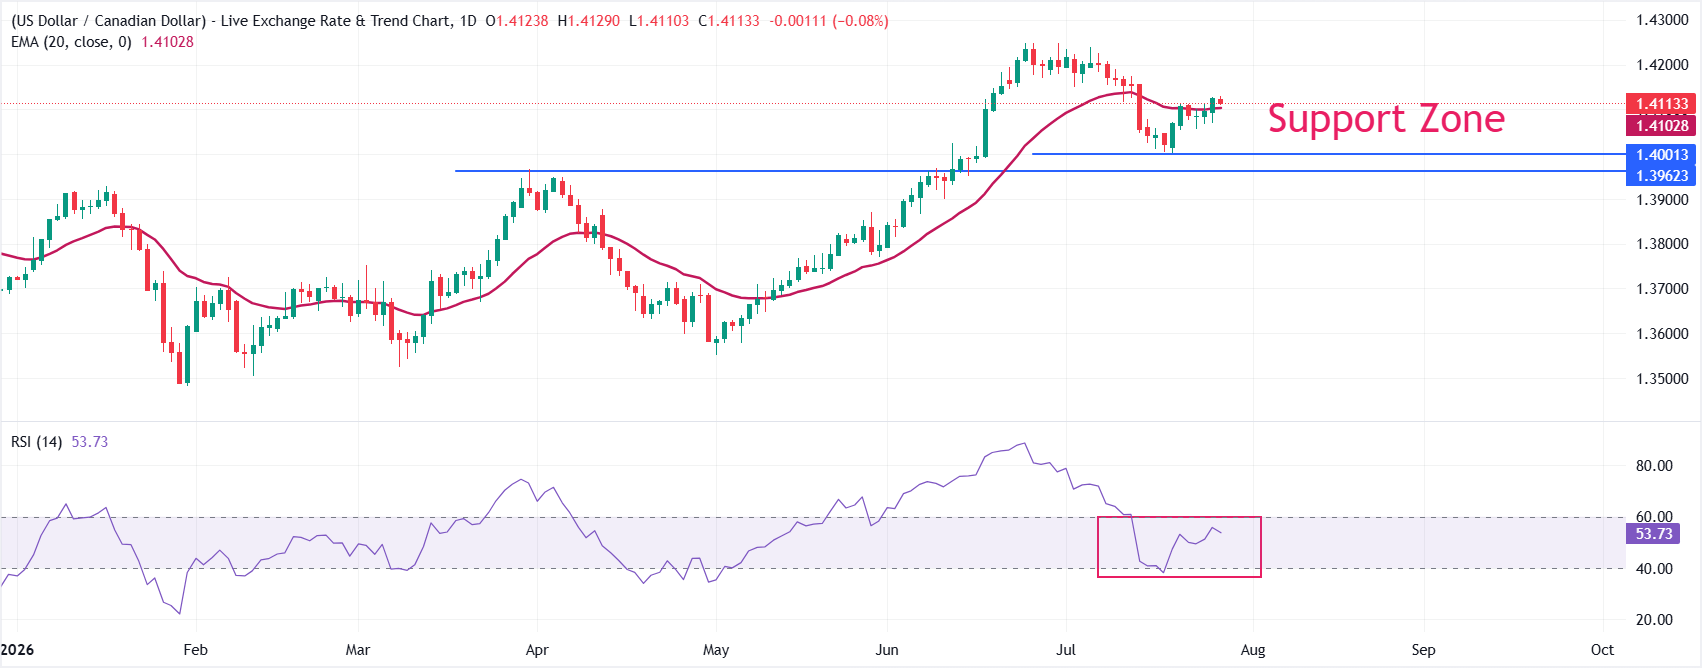
USD/CAD trades slightly lower at around 1.4113. The pair wobbles near the 20-day exponential moving average (EMA), which is at 1.4103, suggesting a sideways trend.
The Relative Strength Index (RSI) at 53.7 has drifted back toward neutral territory, hinting that upside momentum has cooled but not reversed, leaving scope for a gradual grind higher while the price stays supported by the short-term EMA.
On the downside, the area between 1.3962 and 1.4001 would be the key demand zone for the pair. Looking up, the pair needs a decisive break above the July 14 high at 1.4157 to revisit the yearly high at 1.4248.
(The technical analysis of this story was written with the help of an AI tool. Know more.)
Economic Indicator
Fed Interest Rate Decision
The Federal Reserve (Fed) deliberates on monetary policy and makes a decision on interest rates at eight pre-scheduled meetings per year. It has two mandates: to keep inflation at 2%, and to maintain full employment. Its main tool for achieving this is by setting interest rates – both at which it lends to banks and banks lend to each other. If it decides to hike rates, the US Dollar (USD) tends to strengthen as it attracts more foreign capital inflows. If it cuts rates, it tends to weaken the USD as capital drains out to countries offering higher returns. If rates are left unchanged, attention turns to the tone of the Federal Open Market Committee (FOMC) statement, and whether it is hawkish (expectant of higher future interest rates), or dovish (expectant of lower future rates).
Read more.Next release: Wed Jul 29, 2026 18:00
Frequency: Irregular
Consensus: 3.75%
Previous: 3.75%
Source: Federal Reserve
Nothing in this material constitutes investment advice, personal recommendation, investment research, an offer, or a solicitation to buy or sell any financial instrument. The content has been prepared without consideration of your individual investment objectives, financial situation, or needs, and should not be treated as such.
Past performance is not a reliable indicator of future performance and/or results. Forward-looking scenarios or forecasts are not a guarantee of future performance. Actual results may differ materially from those anticipated.
Mitrade makes no representation or warranty as to the accuracy or completeness of the information provided and accepts no liability for any loss arising from reliance on such information.
Recommended Articles


