



GBP/JPY Price Forecast: 50-day SMA caps sideways trading
- GBP/JPY holds near 215.00 as traders avoid directional bets.
- Flat RSI signals neither buyers nor sellers control momentum.
- Break above 215.43 exposes 216.00 and 216.50 next.
The GBP/JPY holds firm on Wednesday at around 215.00, as neither buyers nor sellers are reluctant to open fresh directional bets amid fears of renewed intervention in the FX markets by US and Japanese authorities to propel the Yen. At the time of writing, the cross-pair hovers below the 50-day Simple Moving Average (SMA), barely unchanged.
GBP/JPY Price Forecast: Technical outlook
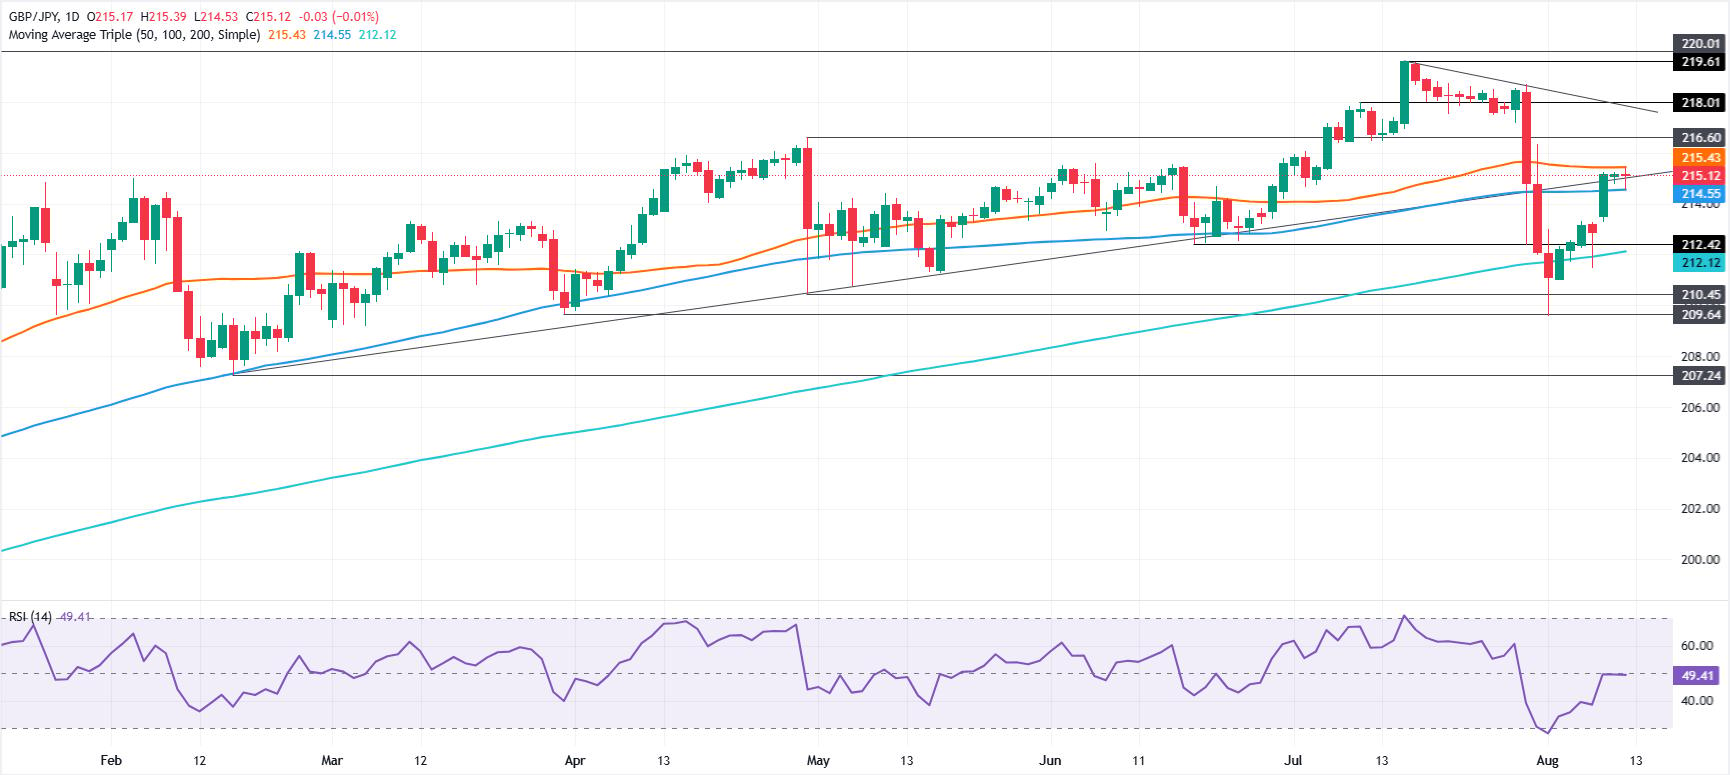
GBP/JPY faces significant resistance levels that are capping its advance, resulting in sideways trading. The Relative Strength Index (RSI), remains flat at the neutral level of 50, suggesting a lack of strong conviction from either buyers or sellers to drive the pair beyond key levels.
On the upside, the initial key resistance is the 50-day SMA at 215.43, followed by 216.00. Breaking this will open the way to the 216.50 level and, subsequently, the 217.00 psychological level.
Downwards, GBP/JPY's first support level is at 215.00, followed by the 100-day SMA at 214.55. Beneath lies the 200-day SMA at 212.12, above the August 7 low of 211.47.
GBP/JPY Price Chart – Daily
Japanese Yen FAQs
The Japanese Yen (JPY) is one of the world’s most traded currencies. Its value is broadly determined by the performance of the Japanese economy, but more specifically by the Bank of Japan’s policy, the differential between Japanese and US bond yields, or risk sentiment among traders, among other factors.
One of the Bank of Japan’s mandates is currency control, so its moves are key for the Yen. The BoJ has directly intervened in currency markets sometimes, generally to lower the value of the Yen, although it refrains from doing it often due to political concerns of its main trading partners. The BoJ ultra-loose monetary policy between 2013 and 2024 caused the Yen to depreciate against its main currency peers due to an increasing policy divergence between the Bank of Japan and other main central banks. More recently, the gradually unwinding of this ultra-loose policy has given some support to the Yen.
Over the last decade, the BoJ’s stance of sticking to ultra-loose monetary policy has led to a widening policy divergence with other central banks, particularly with the US Federal Reserve. This supported a widening of the differential between the 10-year US and Japanese bonds, which favored the US Dollar against the Japanese Yen. The BoJ decision in 2024 to gradually abandon the ultra-loose policy, coupled with interest-rate cuts in other major central banks, is narrowing this differential.
The Japanese Yen is often seen as a safe-haven investment. This means that in times of market stress, investors are more likely to put their money in the Japanese currency due to its supposed reliability and stability. Turbulent times are likely to strengthen the Yen’s value against other currencies seen as more risky to invest in.
Nothing in this material constitutes investment advice, personal recommendation, investment research, an offer, or a solicitation to buy or sell any financial instrument. The content has been prepared without consideration of your individual investment objectives, financial situation, or needs, and should not be treated as such.
Past performance is not a reliable indicator of future performance and/or results. Forward-looking scenarios or forecasts are not a guarantee of future performance. Actual results may differ materially from those anticipated.
Mitrade makes no representation or warranty as to the accuracy or completeness of the information provided and accepts no liability for any loss arising from reliance on such information.
Recommended Articles


